With the start of another month it’s a chance to use my weekly publication slot to review the previous month. Also I’ve somehow settled on publishing one essay a week. That was never a deliberate choice, just an attempt to keep my schedule in line with my energy and enthusiasm during a time that’s drained most of both. August having had five Wednesdays in it, though, I published five things. Here they are, ranked most to least popular:
There are too few data points to do a real test. It does look like this isn’t just chronological order, though. Also, that Kickstarter has closed, but it was very successful. Denise Gaskin’s project collected more than nine times the initial goal and reached all but one of its stretch goals. You can still donate, though, to support an educational-publishing project.
Hey, I was home and puttering around on my computer at midnight Universal Time last week; what are the odds of that?
It was a month of decline in my readership, though. There were 1,760 page views during the month, possibly because whatever drove hundreds of views from Romania in July did not repeat. In fact, there were only two page views from Romania in August. This is below the twelve-month running mean of 2,163.2 views per month, and the twelve-month running median of 2,105.5.
WordPress’s estimate of the number of unique visitors decreased too. There were 1,101 unique visitors here in August. The twelve-month running mean was 1,407.2, for the twelve months leading up to August. The running median was 1,409 unique visitors.
There were 17 things liked here in August, the same number as July. That’s below the mean of 30.9 and median of 29.5. There were no comments in August, for the second month in a row; as you might imagine, this is crashing far below the running median of 5.1 and median of 4. The figures look less bad if you pro-rate things by the number of posts. Then at least the views and unique visitors are between the mean and median numbers. Likes and comments are still low, though.
WordPress estimates that I published 2,617 words in August, bringing my total for the year to 48,472. So my average post length dwindled a bit in August, and it’s reduced my average post length this year to 915.
As of the start of September, WordPress says, I’ve gotten 167,896 page views in total, from a recorded 100,719 unique visitors. And, for good measure, a total of 1,728 posts since I began this blog … eleven? … years ago, and 3,321 comments over that time.
To be a regular reader of my blog, do what you just did right here. You can add my essays to your RSS reader using the https://nebusresearch.wordpress.com/feed address. If you’d rather get messages by e-mail you can use the `Follow Nebusresearch by E-mail’ button in the right-hand column of this page. Or to add it to your WordPress reader, click the ‘Follow Nebusresearch’ button. Thank you for being here for all this.
I have not given up on my mathematics blog, though I admit to its commanding less attention than I have sometimes given it. I have had less attention to give everything. In a month of writing that comes pretty close to simple maintenance mode, I expect pretty average readership figures. I did not have them.
WordPress says that I received 3,071 page views in July, which is the biggest total I’ve had since October 2019, and I believe my second most-read month ever. This is because for some reason I got about a thousand page views from Romania, mostly in the second week of the month. I don’t know why. I usually get about a thousand page views from the United States — in July there were 860 — so this is odd. There were also 339 page views from India, which is up from the usual of one to two hundred, but not so much more as to be clearly wrong. So, much as I like having a big month, I can’t believe in it.
And yeah, I could work out the per-posting average views and unique visitors and all. But given how much of this is someone in Romania hitting refresh on my pages I don’t know that it’s worth composing into sentences.
Because sure, 3,071 is way above the twelve-month running mean of 2,064.8 views per month, and the running median of 2,080 per month. When I look at the count of unique visitors, though? That’s a less exalted 1,193 for July. THat’s close to what June offered me, and below the running mean of 1,418.1 and running median of 1,409 visitors. The things that measure interactions were even more dire: only 17 likes were given around here in July. That’s the lowest figure in at least two and a half years, and below the running mean of 32.3 and running median of 30.5. And finally there were no comments in July, the third time that’s ever happened. My running mean is 7.3 and median 6.5 right now. (Well, there was one submitted comment, on my announcement that I won’t be doing an A-to-Z this year. But it was just a one-word “Nice”. I imagine that’s a spammer doing that thing rather than an attempt to hurt my feelings.)
I would like to report what the relative popularity of July’s posts were. For some reason WordPress won’t tell me. I can get the similar data for my humor blog, so I don’t know what the issue is. Well, here’s what I published this last month:
For the year to date, WordPress figures I’ve published 45,855 words, not counting this post. That’s coming in at an average 955 words per posting, which is dwindling a little. I blame Comic Strip Master Command for not giving me stuff I can go on about all night.
As of the start of August, WordPress says, I’ve gotten 166,185 page views, from a recorded 99,618 unique visitors.
If you’d like to be a regular reader of my blog, thank you. You can add this to your WordPress reader by clicking the ‘Follow Nebusresearch’ button on the right hand column of this page. If you’d like to get it by e-mail, you can use the ‘Follow Nebusrsearch By E-mail’ button below that. If you have an RSS reader, you can get my essays at https://nebusresearch.wordpress.com/feed instead. And thank you for considering reading what I come around to writing.
Some context. Since 2015 I’ve run a series of A-to-Z essays. This is writing a short glossary about various mathematics terms. Most years they were a complete pass through the alphabet, with some fudging to allow for there being fewer terms that start with ‘X’ than you’d think. For 2021, I changed the format up a little, writing instead one for each letter in the phrase “Mathematics A to Z”. You can read all 198 of the completed essays at this link.
Hard as I thought 2021 was, 2022 has been worse, in wearing down my energy and enthusiasm for big projects. Or projects at all. And an A-to-Z is a big, worthwhile but exhausting project. I am already too late in the year to run one essay a week and complete the full alphabet. Given the lead times necessary even a partial alphabet would be hard to fit in. (I don’t want to run these projects across years, although I accepted that for the 2021 project.) In 2015 and 2016 I was able to write three essays a week, a commitment of time and energy I can’t imagine making now.
So rather than sit idly hoping something will turn up, I accept the situation. I am not up for an A-to-Z this year. I hope that 2023 will be a happier year, one in which I can do a project of that magnitude. I suppose we all hope for that.
The folks who signed up to get my posts delivered by e-mail — it’s a box on the rightmost column of this page — know I used that title last month. A typo, basically; I was thinking of the promise of the new month and did not notice my subject line was a month early. I fixed that old post, and nobody seems to have mentioned it. But I like being open about my mistakes as well as my great moments. Also I would like to have more great moments. In any event, here’s to specifics.
WordPress records me as getting 1,749 page views in June. This is a fair bit below the running averages for the twelve months running up to June 2022. The mean has been 2,128.0 views per month, and the median 2,105.5. The number of unique visitors continued its decline to, to 1,159 visitors, compared to a running mean of 1,467.6 and running median of 1,436. I’m sure there’s something that could be done about these figures but it’s impossible to say what. It is setting up a botnet to send spurious page hits.
WordPress says, by the way, that I now have 1,004 followers here, which I believe is the first time I’ve topped a thousand subscribers. I will admit some of these are followers I think are not very engaged, since they’re named things like ‘dubuqueinvestor66161’ and their essays are piles of sentences with heaps of words that I can’t get to cohere into meaning. You know how it is.
I’m staying likeable, at least. 29 posts got liked in June, just about on target for the running mean of 32.9 and running median of 31.5. There were only two comments, but the averages there are a mean of 8.0 and median of 4.5, so it’s not that far off the norm.
Prorated to the scant number of posts made — five this month — the figures look more competitive. There were 349.8 views per posting, on average; the running averages are a mean of 323.5 and median of 302.8. There were 231.8 unique visitors per posting; the mean was 222.2 and median 211.3. 5.8 likes per posting, compared to a mean of 4.6 and median of 4.2. 0.4 comments per posting, the only point where the prorated count was below the average. The running mean per posting was 1.0 and median 0.8.
So here’s the roster of what I posted in June, ranked from most to least popular. Or at least clicked-on; I don’t have the energy to compare how many likes things get.
WordPress figures that I posted 3,256 words in June, an average of 993 words per posting. This is about on par with my recent average, and brings me to 43,706 words for the year to date. That includes a stretch back in January when I was rerunning a lot of material. If you’d like to be a regular reader, I told you up top how to get e-mails sent to you by mail. If you’d rather have them in your WordPress reader, you can use the ‘Follow Nebusresearch button’, in the right column of the page. Or you could set up your RSS reader to use https://nebusresearch.wordpress.com/feed. That’s the best option, really, but the one I won’t see in any of my statistics.
The easy way to put this article is, if I don’t read my mathematics blog why should anyone else? There is truth to this. I have mentioned several times that this has been a difficult year for me, and I’ve had to ration where I put my energy. I’ve avoided going a whole week without a post, but it’s only by reposting old material that I’ve managed that. Even the old standby of writing about the mathematics in comic strips has fallen short, as Comic Strip Master Command isn’t sending so many worth my attention these days. These are strange times.
The result is a decline in my readership, although it’s less of one than I had expected. There were no comments at all around here in May, which, have to say, seems fair. There wasn’t much to comment on, especially with just four essays posted. That’s my lowest posting volume in years. It’s also not the first time I had zero comments in a month, which takes some sting off.
Yes, I see how WordPress claims I have 997 followers — you can join that group by using the ‘Follow Nebusresearch’ button at the upper right of the screen. I suspect a lot of them aren’t following closely, though.
So there were 2,057 page views here in May. That’s a bit below the twelve-month running mean of 2,212.3 views per month leading up to May. And below the running median of 2,114.5 views. Per posting, the number looks impressive, though, with 514.3 page views per posting. That beats the running mean of 309.1 and median of 302.8.
There were 1,358 unique visitors recorded in May. That’s again a slight decline from the 1,528.2 running mean and 1,461.5 running median. And, again, per posting the numbers seem impressive. 339.5 unique visitors with each posting, above the mean of 213.2 and median of 211.3. The implication, yes, is if I didn’t post at all I’d have infinitely many readers, a conclusion which hurts my feelings.
There were twenty likes given in May, up from April but still below the mean of 35.3 and median of 33. It’s a per-posting average of 5.0 likes per posting, above the mean of 4.6 and median of 4.2 but there’s no way there’s statistical significance to that. And, of course, no comments, compared to a running mean of 9.7 and median of 7.
With so few essays posted it’s easy to report the order of their popularity. I’m not sure whether their order depends on how interesting the text was or how early in the month they were posted. There’s no way the difference is statistically significant. But here’s the May 2022 pieces ranked most popular to least:
WordPress figures I started the month with a grand total of 1,714 posts. These all together drew 3,319 comments and 161,316 page views from 97,265 recorded unique visitors. It also figures my average post for the month had 876 words in it, bringing my average post for the year 2022 down to 1,037 words per posting. I’ve managed to put together 40,451 words so far this year. This surprises me by being close to half what I’ve managed on my humor blog, where I post every day. There, I have several regular columns, such as story comic plot summaries, that are popular and relatively easy to write.
Having said all that, will this look at May’s figures affect my writing any? I do think I have enough comic strips for a post, that should be next Wednesday, at least. If Comic Strip Master Command works with me, there could be more. But this all will depend on my emotional and energy reserves.
Some of my faithful readers may wonder: am I preparing to say something sad about this year’s A-to-Z? I’m not prepared to say, not yet. What I am is thinking about whether I want to commit to such a big, hard project. I am aware how much it would tax me to do, and while I would like to have it done, there is so much doing to get there. It will depend on how June treats me.
This past month I moved towards the sort of thing that’s normal for my blog here. Mostly, Reading the Comics posts, with another piece that was about a mathematical curiosity. That is a typical selection of posts when I’m not doing something special, such as an A-to-Z sequence. So, with a new month begun, I like to see how it was received. As usual, I check WordPress’s statistics for the past month, and compare it to the running average for the twelve months leading up to that.
WordPress figures there were 2,121 page views here in April. That’s a little below the running mean of 2,286.8 page views. It’s almost exactly at the running median, though, of 2,122 page views in a month. So this suggests April turned out quite average. There were 1,404 recorded unique visitors. This is below the running mean of 1,602.7 unique visitors, and noticeably below the running median of 1,479. This suggests a month a bit below average.
Per posting, though? That suggests an increasing readership. There were 424.2 page views recorded per posting in April, above the running mean of 301.7 and running median of 302.8. There were 280.8 unique visitors per posting, also well above the 211.1 mean and 211.3 median. That’s not to say every post got 281 visitors, since many of the visitors looked at stuff from before April. This is what keeps me from re-blogging even more repeats.
I know that, on average, my readership has been growing with convincing steadiness for the last five years or so. But part of me still feels like there must be something I could do to get to, like, the reliable 2500-views-a-month level, or higher.
That it was a slow month seems supported by the record of likes and comments, though. There were 19 likes given in April, well below the mean of 39.5 and median of 39. That’s a little less bad considered per posting, but still. That’s 3.8 likes per posting, below the running mean of 5.0 and running median of 4.5. There were an anemic two comments, way below the mean of 11.3 and median of 9.5. That’s just 0.4 comments per posting, compared to an already not-great mean of 1.4 and median of 1.2.
I had thought I posted more in April than a mere five pieces. Not so. Here’s the order of popularity of my posts, which are not quite in chronological order. I too quirk an eye at what the most popular thing of April was:
WordPress figures I posted 3,089 words in April, my fewest since September. And that comes to an average of 617.8 words per posting, again my lowest since September. For the year I’ve published 36,947 words, and have averaged 1,056 words per posting.
I started May with a total of 159,259 recorded page views from a recorded 95,907 unique visitors. But WordPress didn’t start telling us unique visitor counts until my blog here was a couple years old, so don’t take that too literally.
I’d be glad if you chose to be a regular reader. There’s a button at the upper right of the page, “Follow Nebusresearch” which adds this blog to your WordPress reader. There’s a field below that to get posts e-mailed as they’re published. I do nothing with the e-mail except send those posts, but who knows what WordPress Master Command does with them? And if you have an RSS reader, you can put the essays feed into that. If you don’t have an RSS reader, you can sign up for a free account at Dreamwidth. You can use the ‘Reader’ page over there for this and any other RSS feeds you might want to follow.
I expected readers to be happy I was finishing the Little 2021 Mathematics A-to-Z. My doubt was how happy they would be. Turns out they were a middling amount of happy. So this is my regular review of the readership statistics for the past month, as provided by WordPress.
I published eight things in March, which is average for me the past twelve months. It was a long, long time ago that I went whole months posting something every day. But my twelve-month running mean has been 8.5 posts per month, and the median 8, so that’s just in line. There were 2,272 page views recorded in March, which is below the running mean of 2,336.4 and above the running median of 2,122. So, average, like I said. There were 1,545 unique visitors, below the running mean of 1,640.0 and above the running median of 1,479.
It’s uncanny how well this chart matches my mood.
Prorated by posting, the showing is a little worse. There were 284.0 views and 193.1 unique visitors per posting in March. The running mean is 301.9 views and 211.6 visitors per posting. The median, 302.8 views and 211.3 visitors. I have no explanation for this phenomenon.
I have a hypothesis. There were 32 likes given in the month, below the mean of 39.3 and median of 35. But several of the posts were pointers to other essays and those are naturally less well-liked. That came to 4.0 likes per posting, below the mean of 4.9 likes per posting and median of 4.5 likes per posting. Comments were anemic again, with only four given in the month. The mean is an impossible-seeming 11.8 and median 10. Per posting, there were 0.5 comments here in March, compared to a mean of 1.4 and median of 1.2. So it goes.
What was popular in March? Pi Day comic strips, of course, and my making something out of the NCAA March Madness basketball tournament. Here’s the March postings in descending order of popularity.
Stuff from before this past month was popular too, including several of the individual Pi Day pages. And my post about the most and least likely dates for Easter, which is sure to be a seasonal favorite.
WordPress figures that I posted 6,655 words in March, for an average post length of 1,128. If that number seems familiar it does to me too. I had 1,128 words per posting, on average, in January too, an event that caused me to go check that I hadn’t recorded something wrong. But that was also a month with many more posts (many repeats). This brought my average words per post for the year down to 831.9, close to half what my average was at the end of February.
WordPress figures that I started April 2022 with a total of 1,705 posts here. They’d drawn 3,317 comments, with a total 157,138 views from 94,502 recorded unique visitors.
If you’d like to be a regular reader around here, please read. There’s a button at the upper right of the page, “Follow Nebusresearch”. That adds this blog to your WordPress reader. There’s a field below that to get posts e-mailed as they’re published. I do nothing with the e-mail except send those posts. WordPress probably has some incomprehensible page where they say what the do with your e-mails. And if you have an RSS reader, you can put the essays feed into that.
This past month I finished my hiatus, the one where I reran old A-to-Z pieces instead of finishing off what I thought would be a simple, small project for 2021. And, after a mishap, got back to finishing things. As a result I published fewer pieces in February than I had since October. I had an inflated posting record in December and January, from reposting old material. I expected that end to shrink my readership again. And, yes, that’s what happened.
In February, according to WordPress, I attracted 1,875 page views. That’s below the twelve-month running mean of 2,360.8 page views leading up to February 2022. It’s also below the running median of 2,151.5 page views. In fact, it’s the lowest number of page views in a month going back to July 2020, around here.
That huge peak in October 2019, about to fall off this view? That’s from one Redit-like aggregator having one thread that noticed me, and people coming in to look at one piece. Really shows how big the Internet is and how slight my place in it is.
Ah, but what about unique visitors? There were 1,313 of those, figures WordPress. That’s below the twelve-month running mean of 1,661.9 and the running median of 1,534.5. It happens that’s also the lowest monthly figure going back to July 2020. (Although that by a whisker: July 2021 had a couple more views, and unique visitors, than did February 2022. I don’t know what’s wrong with Julys around here.)
The number of likes dropped to 28, way below the mea of 40.9 and median of 39.5. And that was the lowest count since November of 2021. And there were only two comments, way below the mean of 14.9 and median of 10, I haven’t been below that figure since December of 2019. At least these are non-July dates to deal with.
This would all be too sad to bear except that if you look at these figures per posting? Then they snap right back into line. Like, this was in February an average of 312.5 page views every time I posted something. The twelve months leading up to that saw a mean of 301.6 page views per posting and a median of 302.8 page views per posting. February saw 218.8 unique visitors per posting. The running mean was 212.2 and running median 211.3. Even the likes become not so bad: 4.7 per posting. The mean was 5.1 and the median 4.9. In this figuring, the only dire number was comments, a scant 0.3 per posting, compared to mean of 1.9 and median of 1.4. So in that light, you know, things aren’t so bad.
What are the popular things of February? It’s worth running the whole list down. In decreasing order of popularity we have:
Other stuff, from before February, was even more popular, though. It’s getting to be the time of year people look to learn what the most and least likely dates of Easter are, for example. (Easter 2022 is set for the 17th of April. This is on the less-likely side of the band from the 28th of March through 21st of April when Easter is most likely. However, it is one of the most likely dates for Easter in the lifetime of anyone reading this blog, that is, for the span from 1925 to 2100.)
WordPress credits me with publishing 9,163 words in February, for an average post length of 1,527.2 words. This brings my average post length for the year up to 1,237. This is impressive considering I’ve been trying to write my A-to-Zs short for 2021.
WordPress figures that I started March 2022 having posted 1,697 things here. They’ve altogether drawn 3,313 comments from a total 154,866 page views and 92,956 logged unique visitors.
If you’d like to be a regular reader around here, please keep reading. There’s a button at the upper right of the page, “Follow Nebusresearch”, to add this blog to your WordPress reader. There’s a field below that to get posts sent to you in e-mail as they’re published. I do nothing with the e-mail except send those posts; I can’t say what WordPress Master Command does with them. And if you have an RSS reader, you can put the essays feed into that.
Thank you all for your reading, whatever way you do.
I spent a while repeating old A-to-Z materials for the letters T, O, and Z, the unfinished business from my Little 2021 Mathematics A-to-Z. This was to give me the time to recover and to prepare new essays to finish out the already-reduced project from last year. And then I figured once that was done, I could do three posts on successive Wednesdays, and a wrap-up post where I said what I learned. And then I’d be free to do whatever I felt like.
You notice this is not an A-to-Z essay. It’s been a struggle and this morning as I was preparing to finish off a fresh essay I realized: I had picked a topic I did already. No, it was not torus again. But there’s no doing a whole new essay in under three hours, especially not since I need to get groceries before a really nasty-looking bunch of weather we’re getting delivered this evening and tomorrow.
So it’s all pushed back another week again. All I can say is I hope I’ll be happy this hour next week.
It’s a reasonable time for me to check on my readership statistics for the past month. The current month is maybe fourteen minutes from ending, after all. January was my most prolific month since October 2020, with 16 posts published. Nearly all were repostings of old A-to-Z essays. But if you weren’t checking in here in 2015, how would you know the difference, except by my pointing it out?
I have long suspected the thing that most affects my readership is how many times I post. So how did this block of repeat posts affect my readership? Says WordPress, it was like this:
I like the views-per-visitor statistic. I don’t know why it’s only shown in the window that pops up when you hover over one of these monthly bars, though. The posts published per month seem like something it would be interesting to see presented as a bar chart too.
The number of pages viewed in January rose to 2,108, its highest figure since October 2021. That’s below the running averages for the twelve months ending in December 2021, though. The running mean was 2,402.7 views per month, and the median 2,337 views per month. Ah, but what if we rate that per posting? Then there were 131.8 views per posting. The running mean was 321.8 views per posting and the running mean 307.4. (And none of this is to say that any posting got 132 views. Most of what’s read any month is older material. The things that have had the chance to get some traction as the answer to search engine queries.)
The number of unique visitors rose from December, to 1,458 unique visitors in January. That’s still below the running mean of 1,694.5 visitors and the running median of 1,654.5. Per posting, the figure is even more dire: 91.1 visitors per posting, compared to a mean of 226.6 and median of 219.2. These per-posting unique visitor numbers are in line with the sort of thing I did back in 2019 or so, when I had lots of postings in both the A-to-Z and in the Reading the Comics line, though.
There were 51 things liked here in January, a slight rise and even above the mean of 40.1 and median of 38.5. Per posting, that’s 3.2 likes, compared to a mean of 5.3 and median of 5.6. All of these below the likability count of distant years like 2018, which were themselves much less liked than, say, 2015.
Comments fell again, with only four given or received around here in January. The mean is 15.7 and median 11.5. That’s a dire 0.3 comments per posting, although I grant there wasn’t a lot for people to respond to. The mean is 2.0 comments per posting, and median 1.6, and, you know, I’ve had worse months. (February is looking like one!)
I had a lot of posts get at least some views in January. The five most popular posts from the month were:
And for one I have enough posts it feels silly to list all of them in order of decreasing popularity. I’m a touch surprised none of the A-to-Z reposts were among the most popular. What the record suggests is people like amusing little trifles or me talking about myself. Ah, if only it weren’t painful to talk about myself.
WordPress credits me with 18,040 words published in January, for an average of 1,128 words per posting. That’s more than any month of 2020 or 2021, to my surprise.
WordPress figures that as of the start of February I’d posted 1,691 things where, drawing 152,987 views from 91,642 logged unique visitors. And that there were a total of 3,311 comments altogether.
If you would like to see, the easiest way to is to keep reading around here. There’s a button at the upper right of the page, “Follow Nebusresearch”, which should add this page to your WordPress reader. Or you can get posts e-mailed to you, using the ‘Follow Nebusresearch Via E-mail” button beneath that. I do nothing with that e-mail address except send posts. I don’t know what WordPress does with it. Or you can put the RSS feed into your reader, and read what you like without my ability to ever know it, except by your correcting me. However you choose to do it, thank you.
Oh, you know, how did 2021 treat anybody? I always do one of these surveys for the end of each month. It’s only fair to do one for the end of the year also.
2021 was my tenth full year blogging around here. I might have made more of that if the actual anniversary in late September hadn’t coincided with a lot of personal hardships. 2021 was a quiet year around these parts with only 94 things posted. That’s the fewest of any full year. (I posted only 41 things in 2011, but I only started posting at all in late September of that year.) That seems not to have done my readership any harm. There were 28,832 pages viewed in 2021, up from 24,474 in 2020 and a fair bit above the 24,662 given in my previously best-viewed year of 2019. Eleven data points (the partial year 2011, and the full years 2012 through 2021) aren’t many, so there’s no real drawing patterns here. But it does seem like I have a year of sharp increases and then a year of slight declines in page views. I suppose we’ll check in in 2023 and see if that pattern holds.
The number of unique visitors for 2012 is so tiny because they started recording that (so far as they let us know) in, like, late December so that figure is meaningless. The rest seem all right, though.
One thing not declining? The number of unique visitors. WordPress recorded 20,339 unique visitors in 2021, a comfortable bit above 2020’s 16,870 and 2019s 16,718. So far I haven’t seen a year-over-year decline in unique visitors. That’s gratifying.
Less gratifying: the number of likes continues its decline. It hasn’t increased, around here, since 2015 when a seemingly impossible 3,273 likes were given by readers. In 2021 there were only 481 likes, the fewest since 2013. The dropping-off of likes has looked so resembled a Poisson distribution that I’m tempted to see whether it actually fits that.
I know, my first thought was that it looked like an overdamped system receiving a shock, but I don’t think the decline is consistent enough to support that.
The number of comments dropped a slight bit. There were 188 given around here in 2021, but that’s only ten fewer than were given in 2020. It’s seven more than were given in 2019, so if there’s any pattern there I don’t know it.
WordPress lists 483 posts around here as having gotten four or more page views in the year. It won’t tell me everything that got even a single view, though. I’m not willing to do the work of stitching together the monthly page view data to learn everything that was of interest however passing. I’ll settle with knowing what was most popular. And what were my most popular posts of the year mercifully ended? These posts from 2021 got more views than all the others:
No, You Can’t Say What 6/2(1+2) Equals. This was in response to a thing going around Twitter. My @nebusj account has gone feral (Safari didn’t want to load it and I don’t care enough to sort out the problem), but people bring stuff up to me now and then.
How Did Compute!’s Gazette’s MLX Program Work? A bit of retrocomputing work I did, as I finally got enough energy together to answer something I had wondered about since the mid-80s. It turns out to be pretty straightforward.
How To Find A Logarithm Without Much Computing Power This is a compilation post, identifying the pieces from an earlier sequence of essays. But it’s still interesting and useful, if you want to know the hard work of calculating logarithms.
My Little 2021 Mathematics A-to-Z: Hyperbola This, finally, is something from my big project of the year showing up. I don’t know why ‘hyperbola’ got so popular. I suspect it’s that people have a lot of questions about hyperbolas. And I got to combine that with some thoughts about why hyperbolas seem scary in a way that ellipses don’t.
Here’s how to get rid of WordPress’s Block Editor and get the good editor back This is a public service and I hope everyone trying to use WordPress to blog can use this. Yes, I have noticed they’re trying to make the good editor annoying, by having menu bars pop up automatically opened. Don’t give up. Even the old editor hit by an annoying stick is better than the Block Editor.
Hey look, it’s a naturally occurring International Telecommunication Union zonal map! And at this point may I point out that besides being a lower-tier pop-mathematics writer I am also a lower-tier humor blogger?
There were 143 countries, or country-like entities, sending me any page views in 2021. I don’t know how that compares to earlier years. But here’s the roster of where page views came from:
Country
Readers
United States
13,723
Philippines
3,994
India
2,507
Canada
1,393
United Kingdom
865
Australia
659
Germany
442
Brazil
347
South Africa
296
European Union
273
Sweden
230
Singapore
210
Italy
204
Austria
178
France
143
Finland
141
Malaysia
135
South Korea
135
Hong Kong SAR China
132
Ireland
131
Netherlands
117
Turkey
117
Spain
107
Pakistan
105
Thailand
102
Mexico
101
United Arab Emirates
100
Indonesia
97
Switzerland
95
Norway
87
New Zealand
86
Belgium
76
Nigeria
76
Russia
74
Japan
64
Taiwan
62
Bangladesh
58
Poland
55
Greece
54
Denmark
52
Colombia
51
Israel
49
Ghana
46
Portugal
44
Czech Republic
40
Vietnam
38
Saudi Arabia
33
Argentina
30
Lebanon
30
Ecuador
28
Nepal
28
Egypt
25
Kuwait
23
Serbia
22
Chile
21
Croatia
21
Jamaica
20
Peru
20
Tanzania
20
Costa Rica
19
Romania
17
Trinidad & Tobago
17
Sri Lanka
16
Ukraine
15
Hungary
13
Jordan
13
Bulgaria
12
China
12
Albania
11
Bahrain
11
Morocco
11
Estonia
10
Qatar
10
Slovakia
10
Cyprus
9
Kenya
9
Zimbabwe
9
Algeria
8
Oman
8
Belarus
7
Georgia
7
Honduras
7
Lithuania
7
Puerto Rico
7
Venezuela
7
Bosnia & Herzegovina
6
Ethiopia
6
Iraq
6
Belize
5
Bhutan
5
Moldova
5
Uruguay
5
Dominican Republic
4
Guam
4
Kazakhstan
4
Macedonia
4
Mauritius
4
Zambia
4
Åland Islands
3
Antigua & Barbuda
3
Bahamas
3
Cambodia
3
El Salvador
3
Gambia
3
Guatemala
3
Slovenia
3
Suriname
3
American Samoa
2
Azerbaijan
2
Bolivia
2
Cameroon
2
Guernsey
2
Malta
2
Papua New Guinea
2
Réunion
2
Rwanda
2
Sudan
2
Uganda
2
Afghanistan
1
Andorra
1
Armenia
1
Fiji
1
Grenada
1
Iceland
1
Isle of Man
1
Latvia
1
Liberia
1
Liechtenstein
1
Luxembourg
1
Maldives
1
Marshall Islands
1
Mongolia
1
Myanmar (Burma)
1
Namibia
1
Palestinian Territories
1
Panama
1
Paraguay
1
Senegal
1
St. Lucia
1
St. Vincent & Grenadines
1
Togo
1
Tunisia
1
Vatican City
1
I don’t know that I’ve gotten a reader from Vatican City before. I hope it’s not about the essay figuring what dates are most and least likely for Easter. I’d expect them to know that already.
My plan is to spend a bit more time republishing posts from old A-to-Z’s. And then I hope to finish off the Little 2021 Mathematics A-to-Z, late and battered but still carrying on. I intend to post something at least once a week after that, although I don’t have a clear idea what that will be. Perhaps I’ll finally work out the algorithm for Compute!’s New Automatic Proofreader. Perhaps I’ll fill in with A-to-Z style essays for topics I had skipped before. Or I might get back to reading the comics for their mathematics topics. I’m open to suggestions.
On my humor blog I joked I was holding off on my monthly statistics recaps waiting for December 2021 to get better. What held me back here is more attention- and energy-draining nonsense going on last week. It’s passed without lasting harm, that I know about, though. So I can get back to looking at how things looked here in December.
December was, technically, my most prolific month in the sorry year of 2021. I had twelve articles posted, in a year that mostly saw around five to seven posts a year. But more than half of them were repeats, copying the text of old A-to-Z’s, with a small introduction added. I’ve observed how much my readership seems to depend on the number of posts made, more than anything else. How did this sudden surge affect my statistics? … Here’s how.
I can’t wait for the number of followers to roll over to 1,000, so that it’s easy to consider how many people hit ‘follow’ and then never read a word of my writing ever again.
This was another declining month, with the fewest number of page views — 1,946 — and unique visitors — 1,351 — since July 2021. As you’d expect, this was also below the twelve-month running means, of 2,437.7 views from 1,727.8 unique visitors. It’s also below the twelve-month running medians, of 2,436.5 views from 1,742 unique visitors.
I notice, looking at the years going back to 2018, that I’ve seen a readership drop in December each of the last several years. In 2019 my December readership was barely three-fifths the November readership, for example. In 2018 and 2020 readership fell by one-tenth to one-fifth. But those are also years where my A-to-Z was going regularly, and filling whole weeks with publication, in November, with only a few pieces in December. Having December be busier than November is novel.
So I’m curious whether other blogs see a similar November-to-December dropoff. I’m also curious if they have a publishing schedule that makes it easier to find actual patterns through the chaos.
There were 46 things liked in December, which is above the running mean of 40.5 and median of 38.5. There were nine comments given, below that mean of 15.3 and median of 11.5. On the other hand, what much was there to say? (And I appreciate each comment, particularly those of moral support.)
The per-posting numbers, of views and visitors and such, collapsed. I had expected that, since the laconic publishing schedule I settled on drove the per-posting averages way up. The twelve-month running mean of views per posting was 323.4, and median 307.4, for example. December saw 162.2 views per posting. There were a running mean of 228.4 visitors per posting, and median of 219.2 per posting, for the twelve months ending with November 2021. December 2021 saw 112.6 visitors per posting. So those numbers are way down. But they aren’t far off the figures I had in, say, the end of 2020, when I was doing 18 or 19 posts per month.
Might as well list all twelve posts of December, in their descending order of popularity. I’m not surprised the original A-to-Z stuff was most popular. Besides being least familiar, it also came first in the month, so had time to attract page views. Here’s the roster of how the month’s postings ranked.
WordPress credits me with publishing 16,789 words in December, an average of 1,399.1 words per post. That’s not only my most talkative month for 2021; that’s two of my most talkative months. There’s a whole third of the year I didn’t publish that much. This is all inflated by my reposting old articles in their entirety, of course. In past years I would include a pointer to an old A-to-Z essay, but not the whole thing.
This all brings my blog to a total 67,218 words posted for the year. It’s not the second-least-talkative year after all, although I’ll keep its comparisons to other years for a separate post.
At the closing of the year, WordPress figures I’ve posted 1,675 things here. They drew a total 150,883 page views from 90,187 visitors. This isn’t much compared to the first-tier pop-mathematics blogs. But it’s still more people than I could expect to meet in my life. So that’s nice to know about.
As I come near the end of the Little 2021 Mathematics A-to-Z, I also come to the start of December. So that’s a good time to look at the past month and see how readers responded to my work. Over November I published seven pieces, and here’s how they sorted out, most popular to the least, as WordPress counts their page views:
There’s an obvious advantage stuff published earlier in the month has. Still, this is usually around the time in an A-to-Z sequence where I get hit by a content aggregator and one post gets 25,000 views in a three-hour period and then falls back to normal. Would be a mood lift.
After a suspiciously average October, I saw another underperforming November. I mean underperforming compared to the twelve-month running average leading up to November. The mean, leading up to November, monthly page view was 2,501.8, and the median was 2,527. In actual November, I got 2,103 page views. The mean number of unique visitors was 1,775.7, and the running median 1,752. In fact, there were 1,493 unique visitors.
Rated per posting, though, it doesn’t look so bad. There were on average 300.4 page views for each of the seven postings this past month. The twelve-month running mean was 314.3 views per posting, and the median 307.4. There were 213.3 unique visitors per posting in November. This is insignificantly below the running mean 222.1 unique visitors per posting, and running median of 217.2 visitors per posting. (And, again, this is views to anything at all on my blog, per new posting. Sometime, I’ll have to dare a month with no posts to learn how much my back catalogue gets on its own weight.)
I feel like views per visitor are always the same number. At least something in the 1.4 to 1.5 range. They’re not; back in April the views per visitor were 1.31, and in February 1.38. Still, it doesn’t seem like it varies a lot.
I am at least growing less likable, confirming a fear. There were 25 likes given in November, the second month in a row it’s been less than one like a day. The mean was 43.4 likes per day, and the median 42. It doesn’t even look good rated per posting: this came out to 3.6 likes per posting, compared to a running mean of 5.3 and running median of 5.6. Comments offer a little hope, at least, with 13 comments given over the course of November. The mean was 15.1 and median 10.1. Per posting, this gets right on average: November averaged 1.9 comments per posting, and the twelve-month running mean was 1.9. The twelve-month running median was 1.4 comments per posting, so I finally found a figure where I beat an average.
WordPress figures I published 6,106 words this past month. It’s my second-most loquacious month this year, with an average 872.3 words per November posting. It brings my total for the year to 50,429 words, averaging 623 words per posting. Unless December makes some big changes this is going to be my second-least-talkative year of the blog.
As of the start of November I’ve had 1,663 postings here. They’ve drawn a total 148,937 views, from 88,561 unique visitors.
If you’d like to follow this blog regularly, I’d be glad if you did. You can use the “Follow Nebusresearch” button at the upper right corner of this page. Or you can get essays by e-mail as soon as they’re published, using the box just below that button. I don’t use the e-mail for anything but sending these essays. I don’t know how WordPress Master Command uses them.
While my Twitter account has gone feral I am on Mathstodon, the mathematics-themed instance of the Mastodon network. So you can catch me as @nebusj@mathstodon.xyz there. Thank you as ever for reading and for, I hope, the successful conclusion of this year’s little A-to-Z.
I’m aware this is a fair bit into October. But it’s the first publication slot I’ve had free. At least since I want Wednesdays to take the Little 2021 A-to-Z essays, and Mondays the other thing I publish. If that, since October ended up another month when I barely managed one essay a week. Let me jump right to that, in fact. The five essays published here in October ranked like this, in popularity, and it’s not just order of publication:
I don’t know what made “Embedding” so popular. I’d suspect I may have hit a much-searched-for keyword except it doesn’t seem to be popular so far in November.
So I got 2,547 page views around here in October. This is up from the last couple months. It’s quite average for the twelve months from October 2020 through September 2021, though. The twelve-month running mean was 2,543.2 page views per month, and the running median of 2,569 views per month. I told you it was average.
Hey, they forgot to put in the advertisement offering to sell me some kind of further insight this month. Now how will I know to “post content that your readers respond to”?
There were 1,733 unique visitors, as WordPress makes it out. That’s almost, but a bit below average. The running mean was 1,811.3 visitors per month for the twelve months leading up to October. The running median was 1,801 unique visitors. I can make this into something good; it implies people who visited read more stuff. A mere 30 likes were given in October, below the running mean of 47.5 and median of 45. And there were only five comments, below the mean of 16.2 and median of 12.
Given that I’m barely posting anymore, though, the numbers look all right. This was 509.4 views per posting, which creams the running mean of 286.0 and running median of 295.9 views per posting. There were 346.8 unique visitors per posting, even more above the running mean of 203.2 and running median of 205.6 unique visitors per posting. Rating things per posting even makes the number of likes look good: 6.0 per posting, above the mean of 5.2 and median of 4.9. Can’t help with comments, though. Those hang out at a still-anemic 1.0 comments per posting, below the running mean of 1.9 and median of 1.4.
WordPress figures that I published 5,335 words in October, an average of 1,067.0 words per posting. That is my second-chattiest month all year, and my longest words-per-posting for the month. I don’t know where all those words came from. So far for all of 2021 I’ve published 44,323 words, averaging 599 words per essay.
As of the start of November I’ve published 1,656 essays here. They’ve drawn a total 146,834 views from 87,340 logged unique visitors. And drawn 3,285 comments altogether, so far.
If you’d like to follow this blog regularly, please do. You can use the “Follow Nebusresearch” button at the upper right corner of this page. Or you can get essays by e-mail as soon as they’re published, using the box just below that button. I never use the e-mail for anything but sending these essays. I can’t say what WordPress does with them, though.
While my Twitter account is unattended — all it does is post announcements of essays; I don’t see anything from it — I am on Mathstodon, the mathematics-themed instance of the Mastodon network. So you can catch me as @nebusj@mathstodon.xyz there, and I’m not sure anyone has yet. Still, thank you for reading, and here’s hoping for a good November.
Better than it treated me! Which is a joke I used last month too. But it’s been a rough while but that’s all right, it’ll all turn around as soon as I buy one winning PowerBall lottery ticket. And since my custom, when I do play, is to buy two tickets at once, I look to be in very good shape as of Monday’s drawing. Thank you for your concern.
I posted seven things in September, including the much-delayed start of the Little Mathematics A-to-Z. Those postings drew 1,973 views altogether from 1,414 unique visitors. These numbers are far below the running averages for the twelve months running up to September. The mean was 2,580.6 views from 1,830.4 unique visitors per month. The median was 2,559 views from 1,801 unique visitors. So this implies a readership decline.
Per-posting, though, the numbers look better. I recorded 281.9 views per posting in September, from 202.0 unique visitors. (Again, this is total views, of everything, not just of September-dated essays.) The running mean was 273.7 views per posting from 194.0 unique visitors. The running median was 295.9 views per posting from 204.3 unique visitors. That’s all quite in line with things and suggests if I posted more, I would be read more. A fine theory, but how could it be implemented?
I keep looking at that Insights tab and I never get any better at positioning myself.
31 likes were given to things in September, below the running average of 51.6 and the running mean of 47.5. It’s not much better per posting, though: 4.4 likes per posting in September, below the running mean of 5.2 per posting and median of 4.9 per posting. Comments are down a little, too, 10 given in the month compared to a mean of 18.0 and median of 15.5. That translates to 1.4 comments per posting, below the running mean of 1.9 per posting and running median of 1.6 per posting. So, yeah, if Mathematics WordPress isn’t dying it is successfully ejecting me from its body.
The things I posted in September ranked like this, in order of popularity:
WordPress estimates that I published 2,973 words in September, a modest but increasing 424.7 words per posting. My average essay so far this year has grown to 565 words. So far for 2021 I’ve posted 38,988 words. This is terse, for me. There have been years I did that in two months.
As of the start of October I’ve had 144,287 page views from 85,603 logged unique visitors, over the course of 1,651 posts. If you’d like to be a regular reader, please use the “Follow Nebusresearch” button at the upper right corner of this page. If you’d rather have essays sent to you by e-mail, use the button a little below that.
Recent events let me know I should make something explicit. I am interested in and looking for mathematical work. My particular skills are in numerical computing but anyone familiar with my writing knows my interest in education and communication. So I am not looking only for major projects. If you need someone to tutor you through the lesson on the directrix or the separatrix, I am game.
I am open also to computer programming work. My day job for the last decade and a half has got me terribly familiar with Asp.Net C#, SQL, Javascript, jQuery, and the OpenLayers GIS tools. Also I keep thinking to take a weekend and pick up Cobol, to put on the shelf beside my Fortran background.
Better than August 2021 treated me! I don’t wish to impose my woes on you, but the last month was one of the worst I’ve had. Besides various physical problems I also felt dreadfully burned out, which postponed my Little Mathematics A-to-Z yet again. I hope yet to get the sequence started, not to mention finished, although I want to get one more essay banked before I start publishing. If things go well, then, that’ll be this Wednesday; if it doesn’t, maybe next Wednesday.
Still, and despite everything, I was able to post seven things in August, a slow return to form. I am still trying to rebuild my energies. But my hope is to get up to about two posts a week, so for most months, eight to ten posts.
The postings I did do were received with this kind of readership:
I’m going to have such mixed feelings when that great big spike in October 2019 times out of these monthly recaps. I need to figure some way to get someone on Reddit or whoever to just casually mention me, once a week, until I get a book publishing deal. If you know how to arrange the details please leave a comment that I’ll answer by October at the latest.
So that’s a total of 2,136 page views for August. That’s up from July, though still below the twelve-month running mean of 2,572.6 views per month. It’s also below the median of 2,559 views per month. There were 1,465 unique visitors recorded. This is again below the running mean of 1,8237.7 unique visitors, and the running mean of 1,801 unique visitors.
There were 43 things liked in August, below the running mean of 53.4 and running median of 49.5. And there were a meager 10 comments received, below the mean of 18.7 and median of 18. I expect this will correct itself whenever I do get the Little Mathematics A-to-Z started; those always attract steady interest, and people writing back, even if it’s just to thank me for taking one of their topics as an essay.
Rated per-post, everything gets strikingly close to average. August came in at an mean 305.1 views per posting, compared to a twelve-month running mean of 257.2 and running median of 282.6. There were 209.3 unique visitors per posting, compared to a running mean of 182.7 and median of 197.0. There were 6.1 likes per posting, compared to a mean of 5.0 and median of 4.4. The only figure not above some per-post average was comments, which were 1.4 per posting. The mean comments per posting, from August 2020 through July 2021, was 1.9, and the median 1.4.
Here’s how August’s seven posts ranked in popularity, as in, number of page views for each post:
WordPress estimates that I published 2,440 words in August, a meager 348.6 words per post. I told you I was burned out. It estimates that for 2021 I’ve published a total of 36,015 words as of the start of September, an average of 581 words per posting.
You also can get essays e-mailed right to you, at publication. Please use this option if you want me to be self-conscious about the typos and grammatical errors that I never find before publication however hard I try. You can do that by using the “Follow NebusResearch via Email” box to the right-center of the page. If you have a WordPress account, you can use “Follow NebusResearch” on the top right to add my essays to your Reader. And I am @nebusj@mathstodon.xyz, the mathematics-themed instance of the Mastodon network. Thanks for being here, and here’s hoping for a happy September.
I didn’t quite abandon my mathematics blog in July, but it would be hard to prove otherwise. I published only five pieces, which I think is my lowest monthly production on record. One of them was the monthly statistics recap. One pointed to a neat thing I found. Three were pointers to earlier essays I’ve written here. It’s economical stuff, But it draws in fewer readers, a thing I’m conditioned to think of as bad. How bad?
I received 1,891 page views in July, way below the running mean of 2,545.0 for the twelve months ending with June 2021. This is also well below the running median of 2,559. There were 1,324 unique visitors in July, way below the running mean of 1,797.1 and median of 1,801. The number of likes barely dropped from June’s totals, with 34 things given a like here. That’s well down from the mean of 56.8 per month and the 55.5 per month median. And comments were dire, only four received compared to a mean of 20.5 and median of 19.
Now I’m a bit curious if there is a WordPress Statistic that tells you how many posts you had per month. It’d be nice, I guess, to see just how strong a correlation there is between “posting stuff” and “getting read”.
That’s the kind of collapse which makes it look like the blog’s just dried up and floated away. But these readership figures are still a good bit above most of 2020, for example, or all but one month of 2018. I’m feeling the effects of the hedonic treadmill here.
And, now — if we consider that per posting? Suddenly my laconic nature starts to seem like genius. There were an average 378.2 views per posting in July. Not all July posts, but the number of views divided by the number posts given. That’s crushing the twelve-month mean of 232.9 views per posting, and twelve-month median of 235.0 views per posting. There were 264.8 unique visitors per posting. The twelve-month running mean was 165.2 unique visitors per posting, and the median 166.3.
Even the likes and comments look better this way. There were 6.8 likes for each time I posted, above the mean of 4.7 and median of 4.3. There were still only 0.8 comments per posting, below the mean of 1.9 and median of 1.6, but at least the numbers look closer together.
The order of popularity of July’s essays, most to least, was:
The most popular essay of all was No, You Can’t Say What 6/2(1+2) Equals. From this I infer some segment of Twitter got worked up about an ambiguous arithmetic expression again.
WordPress estimates that I published 3,103 words in July. This is an average of merely 517.2 words per posting, a figure that will increase as soon as I get this year’s A-to-Z under way. My average words per posting for 2021 declined to 611 thanks to all this. I am at 33,575 words for the year so far.
If you’d like to get new posts without typos corrected, you can sign up for e-mail delivery. Use the “Follow NebusResearch via Email” box to the right-center of the page here.. Or if you have a WordPress account, you can use “Follow NebusResearch” on the top right to add this page to your Reader. And I am @nebusj@mathstodon.xyz, the mathematics-themed instance of the Mastodon network. Thanks for reading, however you find most comfortable.
It’s the time of month when I like to look at what my popularity is like. How many readers I had, what they were reading, that sort of thing. And I’m even getting to it earlier than usual in the month of July. Credit a hot Sunday when I can’t think of other things to do instead.
According to WordPress there were 2,507 page views here in June 2021. That’s down from the last couple months. But it is above the twelve-month running mean, leading up to June, which was of 2,445.9 views per month. The twelve-month running median was 2,516.5. This all implies that June was quite in line with my average month from June 2020 through May 2021. It just looks like a decline is all.
There were 1,753 unique visitors recorded by WordPress in June. That again fits between the running averages. There were a mean 1,728.4 unique visitors per month between June 2020 and May 2021. There was a median of 1,800 unique visitors each month over that same range.
Hey, remember when I tracked views per visitor? I don’t remember why I stopped doing that. The figures were volatile. But either way had a happy interpretation. A low number of views per visitor implied a lot of people found something interesting. A high number of views per visitor implied people were doing archive-binges and reading everything. I suppose I could start seriously tracking it now but then I’d have to add a column to my spreadsheet.
The number of likes given collapsed, a mere 36 clicks of the like button given in June compared to a mean of 57.3 and median of 55.5. Given how many of my posts were some variation of “I’m struggling to find the energy to write”? I can’t blame folks not finding the energy to like. Comments were up, though, surely in response to my appeal for Mathematics A-to-Z topics. If you’ve thought of any, please, let me know; I’m eager to know.
I had nine essays posted in June, including my readership review post. These were, in the order most-to-least popular (as measured by page views):
In June I posted 7,852 words, my most verbose month since October 2020. That comes to an average of 981.5 words per posting in June. But the majority of them were in a single post, the exploration of MLX, which shows how the mean can be a misleading measure. This does bring my words-per-posting mean for the year up to 622, an increase of 70 words per posting. I need to not do that again.
As of the start of July I’ve had 1,631 posts here, which gathered 138,286 total views from 81,404 logged unique visitors.
If you’d like to be a regular reader, this is a great time for it, as I’ve almost worked my way through my obsession with checksum routines of 1980s computer magazines! And there’s the A-to-Z starting soon. Each year I do a glossary project, writing essays about mathematics terms from across the dictionary, many based on reader suggestions. All 168 essays from past years are at this link. This year’s should join that set, too.
If you’d like to get new posts without typos corrected, you can sign up for e-mail delivery. Or if you have a WordPress account, you can use “Follow NebusResearch” to add this page to your Reader. And I am @nebusj@mathstodon.xyz, the mathematics-themed instance of the Mastodon network. Thanks for reading, however you find most comfortable.
I’ll take this chance now to look over my readership from the past month. It’s either that or actually edit this massive article I’ve had sitting for two months. I keep figuring I’ll edit it this next weekend, and then the week ends before I do. This weekend, though, I’m sure to edit it into coherence. Just you watch.
According to WordPress I had 3,068 page views in May of 2021. That’s an impressive number: my 12-month running mean, leading up to May, was 2,366.0 views per month. The 12-month running median is a similar 2,394 views per month. That startles me, especially as I don’t have any pieces that obviously drew special interest. Sometimes there’s a flood of people to a particular page, or from a particular site. That didn’t happen this month, at least as far as I can tell. There was a steady flow of readers to all kinds of things.
There were 2,085 unique visitors, according to WordPress. That’s down from April, but still well above the running mean of 1,671.9 visitors. And above the median of 1,697 unique visitors.
When we rate things per post the dominance of the past month gets even more amazing. That’s an average 340.9 views per posting this month, compared to a mean of 202.5 or a median of 175.5. (Granted, yes, the majority of those were to things from earlier months; there’s almost ten years of backlog and people notice those too.) And it’s 231.7 unique visitors per posting, versus a mean of 144.7 and a median of 127.4.
The most important thing in tracking all this is I hope to someday catch WordPress giving me the same readership statistics two months in a row.
There were 48 likes given in May. That’s below the running mean of 56.3 and median of 55.5. Per-posting, though, these numbers look better. That’s 5.3 likes per posting over the course of May. The mean per posting was 4.5 and the median 4.1 over the previous twelve months. There were 20 comments, barely above the running mean of 19.4 and running median of 18. But that’s 2.2 comments per posting, versus a mean per posting of 1.7 and a median per posting of 1.4. I make my biggest impact with readers by shutting up more.
I got around to publishing nine things in May. A startling number of them were references to other people’s work or, in one case, me talking about using an earlier bit I wrote. Here’s the posts in descending order of popularity. I’m surprised how much this differs from simple chronological order. It suggests there are things people are eager to see, and one of them is Reading the Comics posts. Which I don’t do on a schedule anymore.
As that last and least popular post says, I plan to do an A-to-Z this year. A shorter one than usual, though, one of only fifteen week’s duration, and covering only ten different letters. It’s been a hard year and I need to conserve my energies. I’ll begin appealing for subjects soon.
In May 2021 I posted 4,719 words here, figures WordPress, bringing me to a total of 22,620 words this year. This averages out at 524.3 words per posting in May, and 552 words per post for the year.
As of the start of June I’ve had 1,623 posts to here, which gathered a total 135,779 views from a logged 79,646 unique visitors.
If you have a WordPress account, you can add my posts to your Reader. Use the “Follow NebusResearch” button to do that. Or you can use “Follow NebusResearch by E-mail” to get posts sent to your mailbox. That’s the way to get essays before I notice their most humiliating typos.
Thank you for reading, however it is you’re doing, and I hope you’ll do more of that. If you’re not reading, I suppose I don’t have anything more to say.
I grant that I’m later even than usual in doing my readership recap. That news about how to get rid of the awful awful awful Block Editor was too important to not give last Wednesday’s publication slot. But let me get back to the self-preening and self-examination that people always seem to like and that I never take any lessons from.
In April 2021 there were 3,016 page views recorded here, according to WordPress. These came from 2,298 unique visitors. These are some impressive-looking numbers, especially given that in April I only published nine pieces. And one of those was the readership report for March.
The 3,016 page views is appreciably above the running mean of 2,267.9 views per month for the twelve months leading up to April. It’s also above the running median of 2,266.5 for the twelve months before. And, per posting, the apparent growth is the more impressive. This averages at 335.1 views per posting. The twelve-month running mean was 185.5 views per posting, and twelve-month running median 161.0.
Similarly, unique visitors are well above the averages. 2,298 unique visitors in April is well above the running mean of 1,589.9, and the running median of 1,609.5. The total comes out to 255.3 unique visitors per posting. The running mean, per posting, for the twelve months prior to April was 130.7 unique visitors per posting. The median was a mere 114.1 views per posting.
There were even nice results in the things that show engagement. There were 70 things liked in April, compared to the mean of 54.1 and median of 49. That’s 7.8 likes per posting, well above the mean of 4.1 and median of 4.0. There were for a wonder even more comments than average, 22 given in April compared to a mean of 18.3 and median of 18. Per-posting, that’s 2.4 comments per posting, comfortably above the 1.5 comments per posting mean and 1.2 comments per posting median. It all suggests that I’m finally finding readers who appreciate my genius, or at least style.
I would have sworn I’d managed ten posts in April. No way to tell, really, except by counting.
I have doubts, of course, because I don’t have the self-confidence to be a successful writer. But I also notice, for example, that quite a few of these views, and visitors, came in a rush from about the 12th through 16th of April. That’s significant because my humor blog logged an incredible number of visits that week. Someone on the Fandom Drama reddit, explaining James Allen’s departure from Mark Trail, linked to a comic strip I’d saved for my own plot recaps. I’m not sure that this resulted in anyone on the Fandom Drama reddit reading a word I wrote. I also don’t know how this would have brought even a few people to my mathematics blog. The most I can find is several hundred people coming to the mathematics blog from Facebook. As far as I know Facebook had nothing to do with the Fandom Drama reddit. But the coincidence is hard to ignore.
As said, I posted nine things in April. Here they are in decreasing order of popularity. This isn’t quite chronological order, even though pieces from earlier in the month have more time to gather views. It likely means something that one of the more popular pieces is a Reading the Comics post for a comic strip which has run in no newspapers since the 1960s.
My writing plans? I do keep reading the comics. I’m trying to read more for comic strips that offer interesting mathematics points or puzzles to discuss. There’ve been few of those, it seems. But I’m burned out on pointing out how a student got a story problem. And it does seem there’ve been fewer of those, too. But since I don’t want to gather the data needed to do statistics I’ll go with my impression. If I am wrong, what harm will it do?
For each of the past several years I’ve done an A-to-Z, writing an essay for each letter in the alphabet. I am almost resolved to do one for this year. My reservation is that I have felt close to burnout for a long while. This is part of why I am posting two or even one things per week, and have since the 2020 A-to-Z finished. I think that if I do a 2021 A-to-Z it will have to be under some constraints. First is space. A 2,500-word essay lets me put in a lot of nice discoveries and thoughts about topics. It also takes forever to write. Planning to write an 800-word essay trains me to look at smaller scopes, and be easier to find energy and time to write.
Then, too, I may forego making a complete tour of the alphabet. Some letters are so near tapped out that they stop being fun. Some letters end up getting more subject nominations than I can fulfil. It feels a bit off to start an A-to-Z that won’t ever hit Z, but we do live in difficult times. If I end up doing only thirteen essays? That is probably better than none at all.
If you have thoughts about how I could do a different A-to-Z, or better, please let me know. I’m open to outside thoughts about what’s good in these series and what’s bad in them.
In April 2021 I posted 5,057 words here, by WordPress’s estimate. Over nine posts that averages 561,9 words per post. Things brings me to a total of 17,901 words for the year and an average 559 words per post for 2021.
As of the start of May I’ve posted 1,614 things here. They had gathered 131,712 views from 77,564 logged unique visitors.
If you have a WordPress account, you can use the “Follow NebusResearch” button, and posts will appear in your Reader here. If you’d rather get posts in e-mail, typos and all, you can click the “Follow NebusResearch by E-mail” button.
On Twitter my @nebusj account still exists, and posts announcements of things. But Safari doesn’t want to reliably let me read Twitter and I don’t care enough to get that sorted out, so you can’t use it to communicate with me. If you’re on Mastodon, you can find me as @nebusj@mathstodon.xyz, the mathematics-themed server there. Safari does mostly like and let me read that. (It has an annoying tendency to jump back to the top of the timeline. But since Mathstodon is a quiet neighborhood this jumping around is not a major nuisance.)
Thank you for reading. I hope you’re enjoying it. And if you do have thoughts for a 2021 A-to-Z, I hope you’ll share them.
So I have to skip my planned post for right now, in favor of good news for WordPress bloggers. I apologize for the insular nature of this, but, it’s news worth sharing.
There it is! ‘Show wp-admin pages if available’ and if they ever stop being available, I’m out of here.
Now for how I came to this knowledge.
About two months ago WordPress pushed this update where I had no choice but to use their modern ‘Block’ editor. Its main characteristics are that everything takes longer and behaves worse. And more unpredictably. This is part of a site-wide reorganization where everything is worse. Like, it dumped the old system where you could upload several pictures, put in captions and alt-text for them, and have the captions be saved. And somehow the Block Editor kept getting worse. It has two modes, a ‘Visual Editor’ where it shows roughly what your post would look like, and a ‘Code Editor’ where it shows the HTML code you’re typing in. And this past week it decided anything put in as Code Editor should preview as ‘This block has encountered an error and cannot be previewed’.
It’s sloppy, but everything about the Block Editor is sloppy. There is no guessing, at any point, what clicking the mouse will do, much less why it would do that. The Block Editor is a master class in teaching helplessness. I would pay ten dollars toward an article that studied the complex system of failures and bad decisions that created such a bad editor.
This is not me being a cranky old man at a web site changing. I gave it around two months, plenty of time to get used to the scheme and to understand what it does well. It does nothing well.
For example, if I have an article and wish to insert a picture between two paragraphs? And I click at the space between the two paragraphs where I want the picture? There are at least four different things that the mouse click might cause to happen, one of them being “the editor jumps to the very start of the post”. Which of those four will happen? Why? I don’t know, and you know what? I should not have to know.
In the Classic Editor, if I want to insert a picture, I click in my post where I want the picture to go. I click the ‘Insert Media’ button. I select the picture I want, and that’s it. Any replacement system should be no less hard for me, the writer, to use. Last week, I had to forego putting a picture in one of my Popeye cartoon reviews because nothing would allow me to insert a picture. This is WordPress’s failure, not mine.
With the latest change, and thinking seriously whether WordPress blogging is worth the aggravation, I went to WordPress’s help pages looking for how to get the old editor back. And, because their help pages are also a user-interface clusterfluff, ended up posting this question to a forum that exists somewhere. And, wonderfully, musicdoc1 saw my frustrated pleas and gave me the answer. I am grateful to them and I cannot exaggerate how much difference this makes. Were I forced to choose between the Block Editor and not blogging at all, not blogging would win.
I am so very grateful to musicdoc1 for this information and I am glad to be able to carry on here.
In normal mathematics communications this is easy. We can use the LaTeX typesetting standard, and I would write something like this:
\left(U - TS\right)\left|\begin{tabular}{cc} -dT^2 & S \\ e^{\imath \pi} & \zeta(0) L \end{tabular} \right|
I haven’t checked that I have the syntax precisely right, but it’s something like that.
WordPress includes a bit of support for LaTeX expressions. Here I mean the standard free account that I have; I can write in some line like
\int_0^M \sum_{j=1}^{N} a_j x^j dx
and it will get displayed neat and clean as
Thing is, the standard installation only has a subset of LaTeX’s commands. This is fair enough. It’s ridiculous to bring the entire workshop out when all you need is one hammer. What I can’t find, though, is a description of what LaTeX tools are available to the standard default WordPress free-account user. My experiments in my own comments suggest that the tabular, and the table, structures aren’t supported. But I can’t find a reference that says what’s allowed and what isn’t. I might, after all, be making a silly error in syntax, over and over. When you make an error in WordPress LaTeX you get a sulky note that the formula does not parse. There’s no hint given to what went wrong, or where. You have to remove symbols until the error disappears, and then reverse-engineer what should have been there.
(And the new WordPress editor does not help either. There is not a single point in the new editor where I am fully sure what clicking the mouse will do, or why. Whether it’ll pop up a toolbar I don’t need, or open a new section I don’t want, or pop up a menu where items have moved around from the last time, or whether it’ll jump back to the start of my post and challenge me to remember what I was doing. I realize it is always popular to complain about a web site change, but usually the changes make at least one thing better than it used to be. I can’t find the thing this has made at all better.)
So I’m hoping to attract information. Does anyone have a list of what LaTeX commands WordPress can use? And how the set of what’s available differs between the original post and the comments on the post? And what, for a basic subscription, you can use to represent a matrix?
Incidentally, here’s how to make WordPress print a line of LaTeX larger. Put a &s=N just before the closing $ of your symbol. That N can be 1, 2, 3, or 4. The bigger the N, the bigger the print. You can also put in 0 or negative numbers, if you want the expression to be smaller. I can’t imagine wanting that, but it’s out there.
March was the first time in three-quarters of a year that I did any Reading the Comics posts. One was traditional, a round-up of comics on a particular theme. The other was new for me, a close look at a question inspired by one comic. Both turned out to be popular. Now see if I learn anything from that.
I’d left the Reading the Comics posts on hiatus when I started last year’s A-to-Z. Given the stress of the pandemic I did not feel up to that great a workload. For this year I am considering whether I feel up to an A-to-Z again. An A-to-Z is enjoyable work, yes, and I like the work. But I am still thinking over whether this is work I want to commit to just now.
That’s for the future. What of the recent past? WordPress’s statistics page suggests that the comics were very well-received. It tells me there were 2,867 page views in March. That’s the greatest number since November, the last full month of the 2020 A-to-Z. This is well above the twelve-month running average of 2,199.8 views per month. And as far above the twelve-month running median of 2,108 views per month. Per posting — there were ten postings in March — the figures are even greater. There were 286.7 views per posting in March. The running mean is 172.9 views per posting, and the running median 144.8.
While I am curious what kind of insights Cloudflare Analytics could hope to offer me, I suspect what it really amounts to is “Cloudflare will allow me to give them some money in exchange for confirmation that the most popular stuff is the things that lots of people like”.
There were 1,993 unique visitors in March. This is well above the running averages. The twelve-month running mean was 1,529.4 unique visitors, and the running median 1,491.5. This is 199.3 unique visitors per March posting, not a difficult calculation to make. The twelve-month running mean was 121.1 viewers per posting, though, and the mean a mere 99.8 viewers per posting. So that’s popular.
Not popular? Talking to me. We all feel like that sometimes but I have data. After a chatty February things fell below average for March. There were 30 likes given in March, below the running mean of 56.7 and median of 55.5. There were 3.0 likes per posting. The running mean for the twelve months leading in to this was 4.2 likes per posting. The running median was 4.0.
And actual comments? There were 10 of them in March, below the mean of 14.3 and median of 10. This averaged 1.0 comments per posting, which is at least something. The running per-post mean is 1.6 comments, though, and median is 1.4. It could be the centroids of regular tetrahedrons are not the hot, debatable topic I had assumed.
Pi Day was, as I’d expected, a good day for reading Pi Day comics. And miscellaneous other articles about Pi Day. I need to write some more up for next year, to enjoy those search engine queries. There are some things in differential equations that would be a nice different take.
As mentioned, I posted ten things in March. Here they are in decreasing order of popularity. I would expect this to be roughly a chronological list of when things were posted. It doesn’t seem to be, but I haven’t checked whether the difference is statistically significant.
In March I posted 5,173 words here, for an average 517.3 words per post. That’s shorter than my average January and February posts were. My average words-per-posting for the year has dropped to 558. And despite my posts being on average shorter, this was still my most verbose month of 2021. I’ve had 12,844 words posted this year, through the start of April, and more than two-fifths of them were March.
As of the start of April I’ve posted 1,605 things to the blog here. They’ve gathered 129,696 page views from an acknowledged 75,266 visitors.
If you’d like to be a regular reader, there’s a couple approaches. One is to read regularly. The best way for you to do that is using the RSS feed in whatever reader you prefer. I won’t see you show up in my statistics, and that’s fine. If you don’t have an RSS reader, you can open a free account at Dreamwidth or Livejournal and add any RSS feed you like. This from https://www.dreamwidth.org/feeds/ or https://www.livejournal.com/syn depending on what you sign up for. If that’s too much, you can use the “Follow NebusResearch By E-mail” button, which will send you essays after they’ve appeared and before I’ve fixed typos.
If you have a WordPress account you can use the “Follow NebusResearch” button to add me to your Reader. If you have Twitter, congratulations; I don’t exactly. My account at @nebusj is still there, but it only has an automated post announcement. I don’t know when that will break. If you’re on Mastodon, you can find me as @nebusj@mathstodon.xyz.
One last thing. WordPress imposed their awful, awful, awful ‘Block’ editor on my blog. I used to be able to us the classic, or ‘good’, editor, where I could post stuff without it needing twelve extra mouse clicks. If anyone knows hacks to get the good editor back please leave a comment.
I hadn’t quite intended it, but February was another low-power month here. No big A-to-Z project and no resumption of Reading the Comics. The high points were sharing things that I’d seen elsewhere, and a mathematics problem that occurred to me while making tea. Very low-scale stuff. Still, I like to check on how that’s received.
I did put together seven posts for February — the same as January — and here’s a list of them in descending order of popularity:
I assume the essay setting out the tea question was more popular than the answer because it had a week more to pick up readers. That or people reading the answer checked back on what the question was. It couldn’t be that people are that uninterested in my actually explaining a mathematics thing.
That’s it for relative popularity. How about for total readership?
Oh, WordPress has given up on that little window promising a strategy to make money while blogging. I’m gratified they admitted it so swiftly.
I had expected readership to continue declining, since I’m publishing fewer things and having my name out there seems to matter. But the decline’s less drastic than I expected. There were 2,167 page views here in February. But in the twelve months from February 2020 through January 2021? I had a mean of 2,137.4 page views, and a median of 2,044.5. That is, I’m still on the high side of my popularity.
There were 1,576 logged unique visitors in February. In the twelve months leading up to that the mean was 1,480.7 unique visitors, and the median 1,395.5.
The figures look more impressive if you rate them by number of postings. In that case in February I gathered 309.6 views per posting, way above the mean of 157.9 and median of 135.6. There were also 225.1 unique visitors per posting, again way above the running mean of 109.9 and median of 90.7.
I’ll dig unpopularity out of any set of numbers, though. There were only 47 likes granted here in February, down from the running mean of 55.8 and median of 55.5. That is still 6.7 likes per posting, above the mean of 3.9 and median of 4.0, but it’s still sparse likings. There were a hearty 39 comments given — my highest number since October 2018 — and that’s well above the mean of 17.0 and median of 18. Per posting, that’s 5.6 comments per posting, the highest I have since I started calculating this figure back in July of 2018. The mean and median comments per posting, for the twelve months leading up to this, were both 1.2.
WordPress’s insights panel tells me I published seven things in February, which matches my experience. I still can’t explain the discrepancy back in January. It says also that I published 3,440 words over February, my quietest month since I started tracking those numbers. It put my average post at 590 words for February, and 573.3 words for the whole year to date.
I start March, if WordPress is reliable, having gathered 126,829 views from 73,273 logged unique visitors. This after 1,595 posts in total.
If you’d like to be a regular reader, I’d be glad to have you. You can read without showing up in my statistics by adding my RSS feed to whatever your RSS reader is. If you don’t have an RSS reader, you can make one by signing up for a free account at Dreamwidth or Livejournal. Then you can add feeds from here, or any web site with an RSS feed. Use https://www.dreamwidth.org/feeds/ for Dreamwidth or at https://www.livejournal.com/syn for Livejournal. More blogs than you think have RSS feeds, even if they’re not advertised. Try adding /feed or /?feed=atom to the end of a blog’s URL. It may work!
If you have a WordPress account you can add me to your Reader by clicking the “Follow Nebusresearch” button on this page. I’ve also re-enabled the “Follow NebusResearch By E-mail” option, for people who want to see posts before I’ve fixed the typos. The typos will never be fixed. Every time an author looks at an old blog post there are three more typos, even if they’ve corrected the typos before.
I did not abandon my mathematics blog in January. I felt like I did, yes. But I posted seven essays, by my count. Six, by the WordPress statistics “Insight” panel. I have no idea what post it thinks doesn’t count, but this does shake my faith in whatever Insights it’s supposed to give me. On my humor blog, which had a post a day, it correctly logs 31. I haven’t noticed other discrepancies either. And it’s not like any of my seven January posts was a reblog which might count differently. One quoted a tweet, but that’s nothing unusual.
I’ve observed that my views-per-post tend to be pretty uniform. The implication then is that the more I write, the more I’m read, which seems reasonable. So what would I expect from the most short-winded month I’ve had in at least two and a half years?
It’s exciting to think what this implies for the month when I publish nothing at all.
So, this might encourage some bad habits in me. There were 2,611 page views here in January 2021. That’s above December’s total, and comfortably above the twelve-month running mean of 2,039.5. It’s also above the twelve-month running median of 2,014.5. This came from 1,849 unique visitors. That’s also above the twelve-month running mean of 1,405.8 unique visitors, and the running median of 1,349 unique visitors.
Where things fell off a bit are in likes and comments. There were 41 likes given in January 2021, below the running mean of 55.2 and running median of 55.5. There were 13 comments received, below the running mean of 16.5 and running median of 18.
Looked at per-post, though, these are fantastic numbers. 373.0 views per posting, crushing the running mean of 138.8 and running median of 135.6 visitors per posting. (And I know these were not all views of January 2021-dated posts.) There were 264.1 unique visitors per posting, similarly crushing the running mean of 95.8 and running median of 90.7 unique visitors per posting.
Even the likes and comments look good, rated that way. There were 5.9 likes per posting in January, above the running mean and median of 3.7 likes per posting. There were 1.9 comments per posting, above the running mean of 1.1 and median of 1.0 per posting. The implication is clear: people like it when I write less.
It seems absurd to list the five most popular posts from January when there were seven total, and two of them were statistics reviews. So I’ll list them all, in descending order of popularity.
WordPress claims that I published 4,231 words in January. Since the Insights panel thinks I published six things, that’s an average of 705 words per post. Since I know I published seven things, that’s an average of 604.4 words per post. I don’t know how to reconcile all this. WordPress put my 2020 average at 672 words per posting, for what that’s worth.
If I can trust anything WordPress tells me, I started February 2021 with 1,588 posts written since I started this in 2011. They’d drawn a total of 124,662 views from 71,697 logged unique visitors.
If you’d like to be a regular reader, you can add the feed for these essays to whatever your RSS reader is. If you don’t have an RSS reader yet, sign up for a free account at Dreamwidth or Livejournal. You can add any RSS feed to your Reading/Friends page from https://www.dreamwidth.org/feeds/ or https://www.livejournal.com/syn. And, if you have a WordPress account, you should be able to click the “Follow Nebusresearch” button on this page, and add this to your reader.
On Twitter I have an account that announces new posts; I guess I’m never going to work out what I have to do to access my account again. My actually slightly active social-media front is @nebusj@mathstodon.xyz on the Mastodon microblogging network. I’m still working out how to be talkative there.
Thank you all for reading. And, I hope to have a follow-up to that MLX post soon. I’m enjoying working towards it.
I like starting the year with a look at the past year’s readership. Really what I like is sitting around waiting to see if WordPress is going to provide any automatically generated reports on this. The first few years I was here it did, this nice animated video with fireworks corresponding to posts and how they were received. That’s been gone for years and I suppose isn’t ever coming back. WordPress is run by a bunch of cowards.
But I can still do a look back the old-fashioned way, like I do with the monthly recaps. There’s just fewer years to look back on, and less reliable trends to examine.
2020 was my ninth full year of mathematics blogging. (I reach my tenth anniversary in September and no, I haven’t any idea what I’ll do for that. Most likely forget.) It was an unusual one in that I set aside what’s been my largest gimmick, the Reading the Comics essays, in favor of my second-largest gimmick, the A-to-Z. It’s the first year I’ve done an A-to-Z that didn’t have a month or two with a posting every day. Also along the way I slid from having a post every Sunday come what may to having a post every Wednesday, although usually also a Monday and a Friday also. Everyone claims it helps a blog to have a regular schedule, although I don’t know whether the particular day of the week counts for much. But how did all that work out for me?
I find it interesting that apparently my readership is just a couple of plateaus and if the trend of the last decade points to anything, it’s another year at about this level before doubling again, if I can hold out that long.
So, I had a year that nearly duplicated 2019. There were 24,474 page views in 2020, down insignificantly from 2019’s 24,662. There were 16,870 unique visitors in 2020, up but also insignificantly from the 16,718 visiting in 2019. The number of likes continued to drift downward, from 798 in 2019 to 662 in 2020. My likes peaked in 2015 (over 3200!) and have fallen off ever since in what sure looks like a Poisson distribution to my eye. But the number of comments — which also peaked in 2015 (at 822) — actually rose, from 181 in 2019 to 198 in 2020.
There’s two big factors in my own control. One is when I post and, as noted, I moved away from Sunday posts midway through the year. The other is how much I post. And that dropped: in 2019 I had 201 posts published. In 2020 I posed only 178.
I thought of 2020 as a particularly longwinded year for me. WordPress says I published only 118,941 words, though, for an average of 672 words per posting. That’s my fewest number of words since 2014, though, and my shortest words-per-posting for the year going since 2013. Apparently throwing things off is all those posts that just point to earlier posts.
And what was popular among posts this year? Rather than give even more attention to how many kinds of trapezoid I can think of, I’ll focus just on what were the most popular things posted in 2020. Those were:
I am, first, surprised that so many Reading the Comics posts were among the most-read pieces. I like them, sure, but how many of them say anything that’s relevant one you’ve forgotten whether you read today’s Scary Gary? And yes, I am going to be bothered until the end of time that I was inconsistent about including the # symbol in the Playful Math Education Blog Carnival posts.
I fell off checking what countries sent me readers, month by month. I got bored writing an image alt-text of “Mercator-style map of the world, with the United States in dark red and most of the New World, western Europe, South and Pacific Rim Asia, Australia, and New Zealand in a more uniform pink” over and over and over again. But it’s a new year, it’s worth putting some fuss into things. And then, hey, what’s this?
Now that I’ve had readers from Greenland I just have to try getting a reader from … that bunch of islands north of Scandinavia. Svalbard, I guess? They’ve got upwards of eight people on them, one of them might turn up here by accident someday.
Yeah! I finally got a reader from Greenland! Two page views, it looks like. Here’s the whole list, for the whole world.
Country
Readers
United States
13,527
Philippines
1,756
India
1,390
Canada
1,123
United Kingdom
1,040
Australia
506
Germany
410
Singapore
407
Italy
244
Brazil
232
South Africa
173
Thailand
157
Austria
153
Sweden
143
Japan
142
Finland
138
Netherlands
138
Indonesia
134
France
131
Spain
118
Malaysia
108
Denmark
91
Turkey
88
United Arab Emirates
86
European Union
82
Hong Kong SAR China
81
Argentina
73
Mexico
68
Poland
66
Russia
65
Taiwan
63
New Zealand
60
Belgium
59
Switzerland
59
Norway
58
Pakistan
57
South Korea
57
Romania
51
China
49
Saudi Arabia
49
Colombia
47
Israel
47
Greece
45
Ireland
43
Hungary
40
Portugal
39
Puerto Rico
33
Vietnam
32
Croatia
31
Kenya
30
Egypt
28
Nigeria
25
Oman
24
Chile
23
Czech Republic
22
Jamaica
20
Bangladesh
19
Macau SAR China
19
Qatar
19
Peru
18
Serbia
18
Costa Rica
16
Zimbabwe
16
Albania
15
Bahrain
14
American Samoa
13
Slovenia
13
Sri Lanka
13
Bulgaria
12
Ghana
12
Nepal
12
Ukraine
12
Kazakhstan
11
Trinidad & Tobago
11
El Salvador
10
Lebanon
9
Uganda
9
Cyprus
8
Dominican Republic
8
Ecuador
8
Estonia
8
Honduras
8
Iceland
8
Jordan
8
Belize
7
Brunei
7
Lithuania
7
Slovakia
7
Algeria
6
Iraq
6
Azerbaijan
5
Cameroon
5
Guyana
5
Kuwait
5
Morocco
5
Bahamas
4
Cayman Islands
4
Georgia
4
Luxembourg
4
Macedonia
4
U.S. Virgin Islands
4
Uruguay
4
Venezuela
4
Belarus
3
Bolivia
3
Cambodia
3
Guam
3
Guatemala
3
Laos
3
Latvia
3
Myanmar (Burma)
3
Palestinian Territories
3
Panama
3
Sierra Leone
3
Tanzania
3
Afghanistan
2
Benin
2
Bosnia & Herzegovina
2
Fiji
2
Greenland
2
Tunisia
2
Uzbekistan
2
Barbados
1
Bermuda
1
Bhutan
1
Côte d’Ivoire
1
Cuba
1
Faroe Islands
1
Kyrgyzstan
1
Libya
1
Malawi
1
Malta
1
Mauritius
1
Mongolia
1
Nicaragua
1
Northern Mariana Islands
1
Rwanda
1
Seychelles
1
St. Lucia
1
St. Martin
1
Yemen
1
This is 141 countries, or country-like constructs, all together. I don’t know how that compares to previous years but I’m sure it’s the first time I’ve had five different countries send me a thousand page views each. That’s all gratifying to see.
So what plans have I got for 2021? And when am I going to get back to Reading the Comics posts? Good questions and I don’t know. I suppose I will pick up that series again, although since I took no notes last week, it isn’t going to be this week. At some time this year I want to do another A-to-Z, but I am still recovering from the workload of the last. Anything else? We’ll see. I am open to suggestions of things people think I should try, though.
And now, finally, the close of the All 2020 Mathematics A-to-Z. You may see this as coming in after the close of 2020. I say, well, I’ve done that before. Things that come close to the end of the year are prone to that.
The first important lesson was that I need to read exactly what topics I’ve written about before going ahead with a new week’s topic. I am not sorry, really, to have written about Tiling a second time. I’d rather it have been more than two years after the previous time. But I can make a little something out of that, too. I enjoy the second essay more. I don’t think that’s only because I like my most recent writing more. In the second version I looked at one of those fussy little specific questions. Particularly, what were the 20,426 tiles which Robert Berger found could create an aperiodic tiling? Tracking that down brought me to some fun new connections. And it let me write in a less foggy way. It’s always tempting to write the most generally true thing possible. But details and example cases are easier to understand. It’s surprising that no one in the history of knowledge has observed this difference before I did.
The second lesson was about work during a crisis. 2020 was the most stressful year of my life, a fact I hope remains true. I am aware that ritual, doing regular routine things, helps with stress. So a regular schedule of composing an essay on a mathematical topic was probably a good thing for me. Committing to the essay meant I had specific, attainable goals on clear, predictable deadlines. The catch is that I never got on top of the A-to-Z the way I hoped. My ideal for these is to have the essay written a week ahead of publication. Enough that I can sleep on it many times and amend it as needed. I never got close to this. I was running up close to deadline every week. If I were better managing all this I’d have gotten all November’s essays written before the election, and I didn’t, and that’s why I had to slip a week. I have always been a Sabbath-is-made-for-man sort, so don’t feel bad for slipping the week. But I would have liked to never had had a week when I was copy-editing a half-hour before publication.
It does all imply that I need to do what I resolve every year. Select topics sooner. Start research and drafts sooner. Let myself slip a deadline when that’s needed. But there is also the observation that apparently I can’t cut down the time I spend writing. The first several years of this, believe it or not, I wrote three essays a week for eight intense weeks. These would be six to eight hundred words each. Then I slacked off, doing two a week; these of course grew to a thousand, maybe 1200 words each. For 2020? One essay a week and more than one topped 2500 words. Yes, the traditional joke is that you write a lot because you don’t have the time to write briefly. But writing a lot takes time too.
The third lesson is about biographies. I wrote more biographical sketches for 2020’s than for any previous A-to-Z. Six, if I’m not miscounting, and that without counting historical pieces like Hilbert’s Problems or statistics. These biographies had enlightening minor discoveries. Here I mean learning that Fibonacci seems to have been much less important than I’d imagined. They’re great fun to write, and a different set of challenges from describing what a cohomology might be.
They’re challenging. In the pandemic particularly, as I can’t rely on the university library for a quick biography to read. Or to check journals of mathematical history, although I haven’t resorted to such actual information yet. But I’m also aware that I am not a historian or a real biographer. I have to balance drawing conclusions I can feel confident are not wrong with making declarations that are interesting to read. Still, I enjoy a focus on the culture of mathematics, and how mathematics interacts with the broader culture. It’s a piece mathematicians tend not to acknowledge; our field’s reputation for objective truth is a compelling romantic legend.
I do plan to write an A-to-Z for 2021. I suspect I’ll do it as this year, one per week. I don’t know when I’ll start, although it should be earlier than June. I’ll want to give myself more possible slip dates without running off the year. I will not be writing about tiling again. I do realize that, since I have seven A-to-Z sequences of 26 essays each, I could in principle fill half a year with writing by reblogging each, one a day. I’m not sure the point of such an exercise, but it would at least fill the content hole.
There is a side of me that would like to have a blogging gimmick that doesn’t commit me to 26 essays. I’ve tried a couple; they haven’t ever caught like this has. Maybe I could do something small and focused, like, ten terms from complex analysis. I’m open to suggestions.
When will I resume covering mathematical themes in comic strips? I don’t know; it’s the obvious thing to do while I wait for the A-to-Z cycle to start anew. It’s got some of the A-to-Z thrill, of writing about topics someone else chose. But I need some time to relax and play and I don’t know when I’ll be back to regular work.
I am again looking at the past month’s readership figures. And I’m again doing this in what I mean to be a lower-key form. November was a relatively laconic month for me, at least by A-to-Z standards.
I had only 15 posts in November, not many more than would be in a normal month. The majority of posts were pointers to earlier posts yet. It doesn’t seem to have hurt my readership, though. WordPress says there were 2,873 pages viewed in November, for an average of 191.5 views per posting. This is a good bit above the twelve-month running average leading up to November. That average was a mere 1,912.8 views for a month and 81.6 views per posting. This is because that anomalously high October 2019 figure has passed out of the twelve-month range. There were 2,067 unique visitors logged, for 137.8 unique visitors per posting. The twelve-month running average was 1,294.1 unique visitors for the month, and 81.6 unique visitors per posting. So that’s suggestive of readership growth over the past year.
I’ve gotten far more successful at taking these statistics screenshots right at the transition from one month to another now that there’s nothing to do but refresh web browsers. Ill winds, you know?
The things that signal engaged readers were more ambiguous, as they always are. There were 60 things liked in November, or an average of 4.0 likes per posting. The twelve-month running average had 57.5 likes for a month, and 3.5 likes per posting. There were 11 comments given over the month, an average of 0.7 per posting. And that is below the twelve-month running average of 17.2 for a month and 1.1 comments per posting. I did have an appeal for topics for the A-to-Z, which usually draws comments. But they were for unappealing letters like W and X and it takes some inspiration to think of good mathematics terms for that part of the alphabet.
I like to look over the most popular postings I’ve had but every month it’s either trapezoids or record grooves. I did start limiting my listing to the most popular things posted in the two prior months, so new stuff has a chance at appearing. I make it the two prior months so that things which appeared at the end of a month might show up. And then that got messed up. The most popular recent post was from the end of September: Playful Math Education Blog Carnival 141. It’s a collection of recreational or education-related mathematics you might like. I’m not going to ignore that just because it published three days before October started.
November’s most popular things posted in October or November were:
I have no idea why these post reviews are always popular. I think people might see there’s a list or two in the middle and figure that must be a worthwhile essay. Someday I’ll put up some test essays that are complete nonsense, one with a list and one without, and see how they compare. Of course, now you know the trick and won’t fall for it.
If WordPress’s numbers are right, in November I published 7,304 words, barely more than half of October’s total. It was my tersest month since January. Per post it was even more dramatic: a mere 486.9 words per posting in November, my lowest of the year, to date. My average words per posting, for 2020, dropped to 678.
As of the start of December I’ve had 1,568 total postings here. They’ve gathered 119,685 page views from a logged 68,097 unique visitors.
If you’d like to follow on WordPress, you can add this to your Reading page by clicking the “Follow Nebusresearch” button on the page.
My essays are announced on Twitter as @nebusj. Don’t try to talk with me there. The account’s gone feral. There’s an automated publicity thing on WordPress that posts to it, and is the only way I have to reliably post there. If you want to social-media talk with me look to the mathematics-themed Mathstodon and my account @nebusj@mathstodon.xyz. Or you can leave a comment. Dad, you can also e-mail me. You know the address. The rest of you don’t know, but I bet you could guess it. Not the obvious first guess, though. Around your fourth or fifth guess would get it. I know that changes what your guesses would be.
Thank you all for reading. Have fun with that logic problem.
I’d like to take another quick look at my readership the past month. It’s the third without my doing regular comics posts, although they do creep in here and there.
I posted 19 things in August. That’s slightly up from July. I’m not aiming to do a post-a-day-all-month as I have in past A-to-Z sessions. It’s just too much work. Still, two posts every three days is fairly significant too.
There were 2,040 page views in August, a third month of increasing numbers. It’s below the twelve-month running average of 2,340.3, but that twelve months includes October 2019 when everybody in the world read something. Well, when six thousand people read something, anyway. There were 1,384 unique visitors, as WordPress figures them, in August. Again that’s below the twelve-month running average of 1,590.3. But, you know, the October 2019 anomaly and all that. Both these monthly totals are above the medians, for what that’s worth.
I couldn’t wait for 8:00 pm exactly. … Also, hey, exactly 888 followers, says the ticker, although I know that includes people who forgot they had a WordPress account back in 2013. It’s still a nice round number.
65 things got liked in August, barely above the 62.8 running average. There were 18 comments, a touch above the running average of 16.8.
Prorating things per post, eh, everything is basically the same. 107.4 views per posting, compared to an average of 126.2. 72.8 unique visitors per post, compared to a running average of 85.3. 3.4 likes per posting, compared to an average of 3.5. 0.9 comments per posting, compared to an average 1.0.
The most popular post in August was an old Reading the Comics post. The most popular posts from August this past month were:
You see what I mean about comics posts sneaking back in. Apparently I could have a quite nice, low-effort blog if I just shared mathematics comics without writing anything in depth. Well, I know it’s not fair use if I don’t add something to posting the comic.
As of the start of September I’d had 1,517 posts total here. They’d gathered 111,336 views from a logged 62.216 unique visitors.
I posted 12,051 words in August, my most verbose month by about 800 words. The average post was 634.3 words, which is well down from the start of the year. It’s all those Using My A to Z Archive posts. An A-to-Z essay I always aim for being about 1,200 words and it always ends up about 2,000. And it keeps getting worse.
I’d like to once again take a short look at my readership figures, this time for July 2020. All my projects start out trying to be short and then they billow out to 2,500 words. I don’t know.
I posted 18 things in July. This is above what I do outside A-to-Z months, even without the Reading the Comics posts. There were 1,560 page views in July, which is a higher total than June offered. It’s below the twelve-month running average of 2,323.2 views per month. That stretch includes the anomalously high October 2019 figure, though. Take that out, my page view average was 1746.5, so I’m getting a better sense of how much people want to see me explain comic strips.
There were 1,005 unique visitors here in July. I’m always glad to see that above the 1,000-person mark. The twelve-month running average was 1,579.0 unique visitors, which is a bit higher. That includes the big October 2019 surge, though. Take that out and the running average was 1,144.2 unique visitors, closer to where I did end up.
This is dangerous to observe, but the median page view count the previous twelve months was 1,741; the median unique visitors count was 1,130. Medians are less vulnerable to extremes in a sample (extreme highs or lows), so maybe that’s a guide to whether the month saw readership grow or what. I’ll keep this up until I have no clear answers yet.
Oh, yeah, I don’t know what this offer about earning money is supposed to be but I also know anyone talking about earning money blogging is pulling a scam.
There were 74 things liked in July, above the running average of 60.3. There were 26 comments, comfortably above the running average of 16.3. A-to-Z months have an advantage in comments, certainly.
Rated per posting, the views and visitors were less good. 86.7 views per posting, well below the mean of 129.2. 55.8 unique visitors per posting, below the 87.2 average. But, then, 4.1 likes per posting, above the 3.5 average. And 1.4 comments per posting, above the 1.0 running average.
I want to start looking at just the five most popular posts of the month gone by. That got foiled when three posts all tied for the fifth-most-popular posting. Well, I can deal. The most popular things posted this past month were:
I started the month with 1,498 posts, that have gathered altogether 109,307 views from a logged 60,842 unique visitors.
I published 11,220 words in July, even though so many of my posts were just heads-up to older pieces. It works out to an average 863.1 words per posting in July. My words per post for the year 2020, so far, has dropped to 663. It had been 672 the month before.
If you’d like to be a regular reader, please use the “Follow Nebusresearch” button on this page. Or add my RSS feed to whatever reader you have. If you lack an RSS reader, get a free account at Livejournal or Dreamwidth: their Friends pages can load RSS feeds from whatever source. (Also, if you see any blog you like, try adding /rss or /feed or /rss+xml or /rss+atom to the end of its URL. One of these will often work.) The automated announcement of posts on my Twitter account of @nebusj although that’s been going through a stretch of not letting me on again. I’m trying to hang out more on the mathematics-themed Mathstodon account at @nebusj@mathstodon.xyz. Thank you for reading.
As part of stepping back how much I’ve committed to writing, I had figured to not do my full write-ups of monthly readership statistics. Too many of the statistics were too common, month to month; I don’t need to keep trying to tease information out about which South American countries got a single page view any given month. But I’m not quite courageous enough to abandon them altogether, either.
In June I published 13 pieces, which is a pretty common number. A-to-Z months usually have more than that — last year I managed a several-month streak where I published every single day — but I’m deliberately trying not to do that this time. The number of page views dropped, though. There were 1,318 page views in June, from a recorded 929 unique visitors. That’s way below the twelve-month running averages of 2,289.3 views from 1,551.2 visitors. It’s my lowest page view count since June of 2019, when everybody had that mysterious drop in readers. It’s my lowest visitor count since December 2019.
Mostly I’m not including the map of countries that sent me any readers because I hate having to look up whether it’s Mercatur or Mercator in describing the map projection. You’d think the spell checker would help me, but I have managed to misspell Cincinnati(?) enough times that it won’t tell me when I’m doing that wrong, so I can’t trust it on other words now. Also I’m not positive that WordPress is using Mercator rather than some other casually-similar-looking projection and somehow that’s a distinction I treat as important for my alt text?
There were 22 comments given in June, above the average of 15.4, thanks in part to how A-to-Z sequences appeal directly for comments. There were 43 likes, which is down from the running average of 60.1.
In all, a stunning rebuke to cutting back on my comic strip content. Maybe, anyway. Viewed per posting, it’s a less dramatic collapse. Per posting, there were 101.4 views, compared to an average of 129.2. That’s about four-fifths my average, rather than the three-fifths that the raw numbers implied. There were 71.5 unique visitors per posting, compared to an average of 86.8. Again, that’s a one-fifth drop rather than the two-fifths that the raw figures said I had. 3.3 likes per posting, compared to an average of 3.6. That’s barely a drop. And 1.7 comments per posting, compared to an average 1.0.
The most popular pieces … you know, I don’t need to support the popularity of my grooves-on-a-record-album or the count of different trapezoids. Let me list the five most popular pieces published in June, from June. You can almost see the transition from comics to A-to-Z:
I started July having posted 1,480 things here, gathering 107,748 views from a recorded 59,837 unique visitors. So somewhere along the lines I’ve missed visitor #60,000. Sorry, whoever you were.
I’d published 9,771 words in June, at an average 751.6 words per posting. My average post length so far this year has been 672 words. I’m curious how this will change with me writing one big piece a week, and then a bunch of shorter ones around it.
I think of myself as not a prescriptivist blogger. Here and on my humor blog I do what I feel like, and if that seems to work, I do more of it if I can. If I do enough of it, I try to think of a title, give up and use the first four words that kind of fit, and then ask Thomas K Dye for header art. If it doesn’t work, I drop it without mention. Apart from appealing for A-to-Z topics I don’t usually declare what I intend to do.
This feels different. One of the first things I fell into here, and the oldest hook in my blogging, is Reading the Comics. It’s mostly fun. But it is also work. 2020 is not a year when I am capable of expanding my writing work without bounds. Something has to yield, and my employers would rather it not be my day job. So, at least through the completion of the All 2020 Mathematics A-to-Z, I’ll just be reading the comics. Not Reading the Comics for posting here.
And this is likely a good time for a hiatus. There is much that’s fun about Reading the Comics. First is the comic strips, a lifelong love. Second is that they solve the problem of what to blog about. During the golden age of Atlantic City, there was a Boardwalk performer whose gimmick was to drag a trap along the seabed, haul it up, and identify every bit of sea life caught up in that. My schtick is of a similar thrill, with less harm required of the sea life.
But I have felt bored by this the last several months. Boredom is not a bad thing, of course. And if you are to be a writer, you must be able to write something competent and fresh about a topic you are tired of. Admitting that: I do not have one more sentence in me about kids not buying into the story problem. Or observing that yes, that is a blackboard full of mathematics symbols. Or that lotteries exist and if you play them infinitely many times strange conclusions seem to follow. An exercise that is tiring can be good; an exercise that is painful is not. I will put the painful away and see what I feel like later.
For the time being I figure to write only the A-to-Z essays. And, since I have them, to post references back to old A-to-Z essays. These recaps seemed to be received well enough last year. So why not repeat something that was fine when it was just one of many things?
And after all, the A-to-Z theme is still at heart hauling up buckets of sea life and naming everything in it. It’s just something that I can write farther ahead of deadline, but will not.
Thanks all for reading.
The Boardwalk performer would, if stumped, make up stuff. What patron was going to care if they went away ill-informed? It was a show. The performer just needed a confident air.
I don’t know why my regular review of my past month’s readership keeps creeping later and later in the month. I understand why it does so on my humor blog: there’s stuff that basically squats on the Sunday, Tuesday, Thursday, and Saturday slots. And a thing has to be written after the 1st of the month. So it can get squeezed along. But my mathematics blog has always been more free-form. I think the trouble is that this is always, in principle, an easy post to write, so it’s always easy enough to push off a little longer, and let harder stuff take my attention. It’s always a mystery how my compulsive need to put things in order will clash with my desire to procrastinate my way out of life.
Still, to May. It was another heck of a month for us all. In it, I published only 13 posts, after a couple of 15-post months in a row. Since the frequency of posting is the one variable I am sure is within my control that affects my readership, how did getting a little more laconic affect my readership?
You have no idea how upset I am that I didn’t aimlessly hit ‘reload’ just eleven more times in May.
It’s hard to tell, thanks to the October 2019 spike. But my readership crept up a little. There were 1,989 pages viewed in May. This is below the 12-month running average of 2,205.3, but the twelve-month average still includes that October with 8,667 views. There were 1,407 unique visitors, below but still close to the running average of 1,494.0 unique visitors. There were only 35 likes given, below the average of 60.8. But there were 18 comments, above the running average of 14.9. Of course, the twelve-month running average includes December 2019 when nobody left any comments here.
Taking the averages per posting gives me figures that look a little more popular. 153.0 visitors per posting, above the twelve-month running average of 124.6. 108.2 unique visitors per posting, above the average 83.8. Only 2.7 likes per posting, below the 3.7 average. But 1.4 comments per posting, above the 1.0 average.
Where did all these page views come from? Here’s the roster.
Country
Readers
United States
1,140
India
128
United Kingdom
109
Canada
96
Australia
45
Philippines
41
Singapore
41
China
22
Turkey
22
Germany
21
Italy
17
Netherlands
17
Austria
14
United Arab Emirates
14
Brazil
13
Sweden
13
Finland
11
Denmark
10
France
10
Japan
10
Malaysia
10
Israel
9
Croatia
8
New Zealand
8
South Africa
8
Colombia
7
El Salvador
6
Hong Kong SAR China
6
Hungary
6
Indonesia
6
Norway
6
Poland
6
Taiwan
6
Egypt
5
Greece
5
Pakistan
5
Romania
5
Belgium
4
Qatar
4
Russia
4
Slovakia
4
Spain
4
Albania
3
Chile
3
Jamaica
3
Jordan
3
Mexico
3
Portugal
3
Serbia
3
Switzerland
3
Thailand
3
Ukraine
3
Argentina
2
Cayman Islands
2
Czech Republic
2
Laos
2
Myanmar (Burma)
2
Palestinian Territories
2
South Korea
2
Vietnam
2
Bahrain
1 (*)
Bangladesh
1
Brunei
1
Bulgaria
1
Cyprus
1
Georgia
1
Guyana
1
Honduras
1
Iraq
1
Ireland
1
Kazakhstan
1
Luxembourg
1
Mauritius
1
Nepal
1
Peru
1
Puerto Rico
1
Zimbabwe
1
This is 77 countries or country-like things all told. There’d been 73 in April and 78 in March. 17 of these were single-view countries. There were 12 of those in April and 30 in March. Only Bahrain has been a single-view country for two months in a row, now.
Someday I’ll have a reader in Greenland and I won’t know what to say to them.
All these people looked at, including the home page, 278 posts here. That’s comparable to the 265 of April and 255 of March. 153 pages got more than one view, comparable to the 134 of April and 145 of March. 33 got at least ten views, which is right in line with April’s 36 and March’s 35. The most views were given to some of the usual suspects:
The most popular thing posted in May? That was a tie, actually. One piece was Reading the Comics, May 9, 2020: Knowing the Angles Edition, the usual sort of thing. The other was Reading the Comics, May 2, 2020: What Is The Cosine Of Six Edition, a piece I had meant to follow up on. This is because it so happens that the cosine of six is a number we can, in principle, write out exactly. I had meant to write a post that went through the geometric reasoning that gets you there, but I kept not making time. But, for the short answer, here’s the cosine of six degrees.
This is a number pretty close to 0.99452, and you can get as many decimal digits as you like. You just have to go through working out decimal digits, ultimately, of . I include the first line because if you look closely at it, you’ll get a hint of how to find the cosine of six degrees. It’s the parts of an angle-subtraction formula for cosine.
WordPress estimates me as having published 7,442 words in May. That’s an average of a slender 496.13 words per posting. My average post for the year has fallen to 656 words; at the start of May it had been 691. To the start of June I’ve published 41,978 words here. I don’t know if that counts picture captions and alt text, and have not the faintest idea how it counts LaTeX symbols.
As of the start of June I’ve published 1,467 things, which drew 106,429 views from a recorded 58,907 unique visitors.
I’m hoping next week to start publishing the All 2020 Mathematics A-to-Z. Posts from it should be tagged so as to appear at this link. If you want to be sure you don’t miss any of them, I’m quite flattered. The RSS feed for all my essays as this link, and if you lack an RSS reader, you’re mistaken! You can get a free account at Dreamwidth or Livejournal and use their Reading page to read any RSS feed you like. Or you can click the “Follow Nebusresearch” button on this page, and add it to your WordPress reader.
For a short while there my Twitter account of @Nebusj was working. It’s gone back to where it will just accept WordPress’s automated announcements of posts here, though. I can’t do anything with it. I do have an account on the mathematics-themed Mastodon instance, @nebusj@mathstodon.xyz, and occasionally manage to even just hang out chatting there. It’s hard to get a place in a new social media environment. You need a hook, and you need a playful bit of business anyone can do with you, which both serve to give you an identity. Then you need someone who’s already established to vouch for you as being okay. The A-to-Z is a pretty good hook but the rest is a bit hard. I’m in there trying, though.
Thanks always for reading, however you do it.
Also, because I will someday need this again: to write the symbol in WordPress LaTeX, you need the symbol string ^\circ and do not ask me why it’s not, like, \deg (or better, \degree) instead.
Yes, I feel a bit weird looking at the past month’s readership this early in the month too. I was tempted to go back and look at March’s figures all over again just so I stay tardy. But, no sense putting it off further, especially as I’m thinking to over-commit myself again already.
In April I managed to publish 15 things. This amazes me given that my spirits are about like everyone’s spirits are. I did not repeat having 2,000 readers this past month. But it came surprisingly close. Here’s a look at the readership figures.
There were 1,959 pages viewed over the course of April. This is a bit under the twelve-month running average of 2,127.1. But I’m going to be under the twelve-month running average at least until that October 2019 spike fades into the background. I’m all right with that. There were 1,314 unique visitors, which again is under the running average of 1,440.2 unique visitors in a month.
So while the total number of page views decreased, the number of unique visitors rose. What this means: I’m getting better at driving people off fast. That’s comforting.
The measures that I think of as showing engagement were poor, as they usually are. There were nine comments received over the month, down from the 15.3 average. More surprisingly there were only 44 likes given over the month, noticeably below the 60.4 average.
Everything looks a bit better when pro-rated per posting. The 130.6 views per posting are above even the twelve-month average for that of 120.8 views per posting. The 87.6 unique visitors per posting beats the average of 81.1. It’s still 0.6 comments per posting, below the average of 1.0. And only 2.9 likes per posting, below the average of 3.8. Can’t have everything, I suppose. But I may be doing something to affect that pattern.
There were, counting my home page, 265 postings that got any kind of views in April. That’s up from the 255 of March and 210 of February. 134 of them got more than one view, down from March’s 145 but up from February’s 108. 36 of them got at least ten views, compared to 35 in March and 25 in February. And what got the most page views? About what you’d expect:
The most popular thing I published in April was Rjlipton’s thoughts on the possible ABC Conjecture proof, which is pretty good performance for a post that just says someone else wrote a thing. I don’t know why my headsup posts like that are so reliably popular. But I suppose if people trust my judgement about stuff that’s almost as good as people trusting my prose.
73 countries or country-like things sent me readers in April. 12 of them were single-view countries. This is down from the 78 countries in March, but up from the 67 in February. There had been 30 single-view countries in March and 19 in February, so I guess people are doing more archive-reading, though. Here’s the details for that:
When you hold the mouse over a country that sent you any readers the map pops up with the name of the country and how many views it got. So I went slightly crazy trying to figure out some of those little South Pacific islands until I learned they were lint on my screen. I’d like to know how to zoom into this map.
Country
Readers
United States
1,160
Canada
128
India
105
United Kingdom
102
Australia
34
Singapore
31
Germany
29
Poland
21
Romania
21
Austria
15
Brazil
15
Philippines
15
Finland
14
Netherlands
14
China
13
Italy
13
Ireland
12
Kazakhstan
10
South Korea
10
Thailand
10
American Samoa
9
Japan
9
Saudi Arabia
9
South Africa
9
France
8
Spain
8
Hong Kong SAR China
7
United Arab Emirates
7
Albania
6
Belgium
6
Indonesia
6
Portugal
6
Turkey
6
Kenya
5
Israel
4
Malaysia
4
Slovenia
4
Sweden
4
Switzerland
4
Argentina
3
Croatia
3
Egypt
3
European Union
3
Greece
3
New Zealand
3
Russia
3
Trinidad & Tobago
3
Uruguay
3
Vietnam
3
Bangladesh
2
Czech Republic
2
Denmark
2
Dominican Republic
2
Estonia
2
Greenland
2
Mexico
2
Norway
2
Peru
2
Puerto Rico
2
Serbia
2
Taiwan
2
Bahrain
1
Bosnia & Herzegovina
1
Bulgaria
1
Hungary
1
Kyrgyzstan
1
Lithuania
1 (**)
Malawi
1
Nigeria
1
Pakistan
1
Seychelles
1
Sri Lanka
1
St. Lucia
1
Lithuania has given me a single view each of the last three months. No other countries are on a similar streak.
WordPress says I published a mere 8,566 words in April. That’s my most laconic month since January. With 15 posts, that gives me an average of just under 571.1 words per posting, which is my shortest of the year. It brings my average words per posting for the year down to 691; it had been 721 at the start of April. As of the start of May I’d published 50 posts and 34,536 words since the start of the year.
As of the start of May I’ve posted 1,454 pieces altogether. They’ve drawn 104,439 views from 57,501 acknowledged unique visitors.
I’d be glad, always, to have you as a regular reader. You can put this blog in your WordPress reader by using the “Follow Nebusresearch” button on the upper right corner of the page. If you prefer to use an RSS reader, the feed is available to you. If you don’t have an RSS reader, you can get one as your friends page with a free Dreamwidth or Livejournal account. And, excitingly, my Twitter account @Nebusj has resumed working. I’ll maybe even get back into the habit of using it. I am also on the mathematics-themed Mastodon instance @nebusj@mathstodon.xyz, and trying to figure a good habit for that. We are all on journeys of discovering our new habits, though.
Thank you for reading this. I hope you read more, and maybe comment some. Please take care.


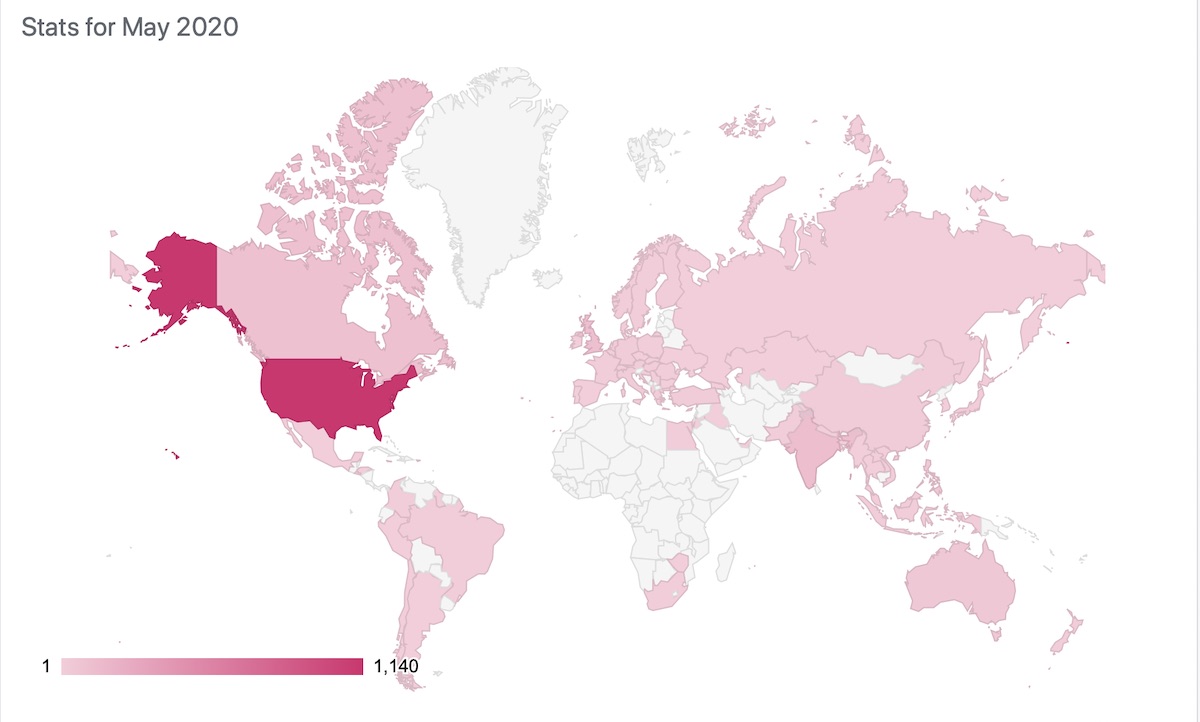

 . I include the first line because if you look closely at it, you’ll get a hint of how to find the cosine of six degrees. It’s the parts of an angle-subtraction formula for cosine.
  symbol in WordPress LaTeX, you need the symbol string ^\circ and do not ask me why it’s not, like, \deg (or better, \degree) instead.

