The handful of comic strips I’ve chosen to write about this week include a couple with characters who want to not be wrong. That’s a common impulse among people learning mathematics, that drive to have the right answer.
Will Henry’s Wallace the Brave for the 8th opens the theme, with Rose excited to go to mathematics camp as a way of learning more ways to be right. I imagine everyone feels this appeal of mathematics, arithmetic particularly. If you follow these knowable rules, and avoid calculation errors, you get results that are correct. Not just coincidentally right, but right for all time. It’s a wonderful sense of security, even when you get past that childhood age where so little is in your control.
A thing that creates a problem, if you love this too closely, is that much of mathematics builds on approximations. Things we know not to be right, but which we know are not too far wrong. You expect this from numerical mathematics, yes. But it happens in analytic mathematics too. I remember struggling in high school physics, in the modeling a pendulum’s swing. To do this you have to approximate the sine of the angle the pendulum bob with the angle itself. This approximation is quite good, if the angle is small, as you can see from comparing the sine of 0.01 radians to the number 0.01. But I wanted to know when that difference was accounted for, and it never was.
(An alternative interpretation is to treat the path swung by the end of the pendulum as though it were part of a parabola, instead of the section of circle that it really is. A small arc of parabola looks much like a small arc of circle. But there is a difference, not accounted for.)
Nor would it be. A regular trick in analytic mathematics is to show that the thing you want is approximated well enough by a thing you can calculate. And then show that if one takes a limit of the thing you can calculate you make the error infinitesimally small. This is all rigorous and you can in time come to accept it. I hope Rose someday handles the discovery that we get to right answers through wrong-but-useful ones well.
Charles Schulz’s Peanuts Begins for the 8th is one that I have featured here before. It’s built on Lucy not accepting that the answer to a multiplication can be zero, even if it is zero times zero. It’s also built on the mixture of meanings between “zero” and “nothing” and “not existent”. Lucy’s right that zero times zero has to be something, as in a thing with some value. But we also so often use zero to mean “nothing that exists” makes zero a struggle to learn and to work with.
Dan Thompson’s Brevity for the 12th is an anthropomorphic numerals joke, built on the ancient playground pun about why six is afraid of seven. And a bit of wordplay about odd and even numbers on top of that. For this I again offer the followup joke that I first heard a couple of years ago. Why was it that 7 ate 9? Because 7 knows to eat 3-squared meals a day!
Lincoln Pierce’s Big Nate for the 14th is a baseball statistics joke. Really a sabermetrics joke. Sabermetrics and other fine-grained sports analysis study at the enormous number of games played, and situations within those games. The goal is to find enough similar situations to make estimates about outcomes. This is through what’s called the “frequentist” interpretation of statistics. That is, if this situation has come up a hundred times before, and it’s led to one particular outcome 85 of those times, then there’s an 85 percent chance of that outcome in this situation.
Baseball is well-posed to set up this sort of analysis. The organized game has always demanded the keeping of box scores, close records of what happened in what order. Other sports can have the same techniques applied, though. It’s not likely that Randy has thrown enough pitches to estimate his chance of giving up a walk-off grand slam. But combine all the little league teams there are, and all the seasons they’ve played? That starts to sound plausible. Doesn’t help the feeling that one was scheduled for a win and then it didn’t happen.
The small set of comic strips with some interesting mathematical content for the first third of the month include an anthropomorphic numerals one and one about the representation of infinity. That’s enough to make a title.
Richard Thompson’s Cul de Sac repeat for the 3rd is making its third appearance in my column! I had mentioned it when it first ran, in July 2012, and then again in its July 2017 repeat. But in neither of those past times did I actually include the comic as I felt it likely GoComics would keep the link to it stable. I’m less confident now that they will keep the link up, as Thompson has died and his comic strip — this century’s best, to date — is in perpetual rerun.
I admit not having many thoughts which I haven’t said twice already. It’s a joke about making a character out of the representation of a number. Alice gives it personality and backstory and, as the kids say these days, lore. Anyway, be sure to check out this blog for the comic’s repeat the 4th of July, 2027. I hope to still be reading then.
I think mathematicians do tend to give, if not personality, at least traits to mathematical constructs. Like, 60, a number with abundant divisors, is likely to be seen as a less difficult number to calculate with than 58 is. A mathematician is likely to see as a pleasant, well-behaved function, but is likely to see as a troublesome one. These examples all tie to how easy they are to do other stuff with. But it is natural to think fondly of things you see a lot that work nicely for you. These don’t always have to be “nice” things. If you want to test an idea about continuous curves, for example, it’s convenient to have handy the Koch curve. It’s this spiky fractal that’s nothing but corners, and you can use it to see if the idea holds up. Do this enough, and you come to see a reliable partner to your work.
Bill Amend’s FoxTrot for the 3rd is the one built on representing infinity. Best that one could hope for given Peter’s ambitious hopes here. I know the characters in this strip and I just little brother Jason wanted a Möbius-strip burger.
Tauhid Bondia’a Crabgrass for the 7th — a strip new to newspaper syndication, by the way — is a cryptography joke. This sort of thing is deeply entwined into mathematics, most deeply probability. This because we know that a three-letter (English) word is more likely to be ‘the’ or ‘and’ or ‘you’ than it is to be ‘qua’ or ‘ado’ or ‘pyx’. And either of those is more likely than ‘pqd’. So, if it’s a simple substitution, a coded word like ‘zpv’ gives a couple likely decipherings. The longer the original message, and the more it’s like regular English, the more likely it is that we can work out the encryption scheme.
But this is simple substitution. What’s a complex substitution? There are many possible schemes here. Their goal is to try to make, in the code text, every set of three-letter combinations to appear about as often as every other pair. That is, so that we don’t see ‘zpv’ happen any more, or less, than ‘sgd’ or ‘zmc’ do, so there’s no telling which word is supposed to be ‘the’ and which is ‘pyx’. Doing that well is a genuinely hard problem, and why cryptographers are paid I assume big money. It demands both excellent design of the code and excellent implementation of it. (One cryptography success for the Allies in World War II came about because some German weather stations needed to transmit their observations using two different cipher schemes. The one which the Allies had already cracked then gave an edge to working out the other.)
It also requires thinking of the costs of implementation. Kevin and Miles could work out a more secure code, but would it be worth it? They just need people to decide their message is too much effort to be worth cracking. Mrs Campbell seems to have reached that conclusion, at a glance. Not sure what Principal Sanders would have decided, were Miles not eager to get out of there. Operational security is always a challenge.
While I continue to wait for time and muse and energy and inspiration to write fresh material, let me share another old piece. This bit from a decade ago examines statistical quirks in The Price Is Right. Game shows offer a lot of material for probability questions. The specific numbers have changed since this was posted, but, the substance hasn’t. I got a bunch of essays out of one odd incident mentioned once on the show, and let me do something useful with that now.
To the serious game show fans: Yes, I am aware that the “Item Up For Bid” is properly called the “One-Bid”. I am writing for a popular audience. (The name “One-Bid” comes from the original, 1950s, run of the show, when the game was entirely about bidding for prizes. A prize might have several rounds of bidding, or might have just the one, and that format is the one used for the Item Up For Bid for the current, 1972-present, show.)
Putting together links to all my essays about trapezoid areas made me realize I also had a string of articles examining that problem of The Price Is Right, with Drew Carey’s claim that only once in the show’s history had all six contestants winning the Item Up For Bids come from the same seat in Contestants’ Row. As with the trapezoid pieces they form a more or less coherent whole, so, let me make it easy for people searching the web for the likelihood of clean sweeps or of perfect games on The Price Is Right to find my thoughts.
I have been reading Pierre-Simon LaPlace, 1749 – 1827, A Life In Exact Science, by Charles Coulson Gillispie with Robert Fox and Ivor Grattan-Guinness. It’s less of a biography than I expected and more a discussion of LaPlace’s considerable body of work. Part of LaPlace’s work was in giving probability a logically coherent, rigorous meaning. Laplace discusses the gambler’s fallacy and the tendency to assign causes to random events. That, for example, if we came across letters from a printer’s font reading out ‘INFINITESIMAL’ we would think that deliberate. We wouldn’t think that for a string of letters in no recognized language. And that brings up this neat quote from Gillispie:
The example may in all probability be adapted from the chapter in the Port-Royal La Logique (1662) on judgement of future events, where Arnauld points out that it would be stupid to bet twenty sous against ten thousand livres that a child playing with printer’s type would arrange the letters to compose the first twenty lines of Virgil’s Aenid.
The reference here is to a book by Antoine Arnauld and Pierre Nicole that I haven’t read or heard of before. But it makes a neat forerunner to the Infinite Monkey Theorem. That’s the study of what probability means when put to infinitely great or long processes. Émile Borel’s use of monkeys at a typewriter echoes this idea of children playing beyond their understanding. I don’t know whether Borel knew of Arnauld and Nicole’s example. But I did not want my readers to miss a neat bit of infinite-monkey trivia. Or to miss today’s Bizarro, offering yet another comic on the subject.
This week’s topic is one of several suggested again by Mr Wu, blogger and Singaporean mathematics tutor. He’d suggested several topics, overlapping in their subject matter, and I was challenged to pick one.
Monte Carlo.
The reputation of mathematics has two aspects: difficulty and truth. Put “difficulty” to the side. “Truth” seems inarguable. We expect mathematics to produce sound, deductive arguments for everything. And that is an ideal. But we often want to know things we can’t do, or can’t do exactly. We can handle that often. If we can show that a number we want must be within some error range of a number we can calculate, we have a “numerical solution”. If we can show that a number we want must be within every error range of a number we can calculate, we have an “analytic solution”.
There are many things we’d like to calculate and can’t exactly. Many of them are integrals, which seem like they should be easy. We can represent any integral as finding the area, or volume, of a shape. The trick is that there’s only a few shapes with volumes we can find exact formulas for. You may remember the area of a triangle or a parallelogram. You have no idea what the area of a regular nonagon is. The trick we rely on is to approximate the shape we want with shapes we know formulas for. This usually gives us a numerical solution.
If you’re any bit devious you’ve had the impulse to think of a shape that can’t be broken up like that. There are such things, and a good swath of mathematics in the late 19th and early 20th centuries was arguments about how to handle them. I don’t mean to discuss them here. I’m more interested in the practical problems of breaking complicated shapes up into simpler ones and adding them all together.
One catch, an obvious one, is that if the shape is complicated you need a lot of simpler shapes added together to get a decent approximation. Less obvious is that you need way more shapes to do a three-dimensional volume well than you need for a two-dimensional area. That’s important because you need even way-er more to do a four-dimensional hypervolume. And more and more and more for a five-dimensional hypervolume. And so on.
That matters because many of the integrals we’d like to work out represent things like the energy of a large number of gas particles. Each of those particles carries six dimensions with it. Three dimensions describe its position and three dimensions describe its momentum. Worse, each particle has its own set of six dimensions. The position of particle 1 tells you nothing about the position of particle 2. So you end up needing ridiculously,impossibly many shapes to get even a rough approximation.
With no alternative, then, we try wisdom instead. We train ourselves to think of deductive reasoning as the only path to certainty. By the rules of deductive logic it is. But there are other unshakeable truths. One of them is randomness.
We can show — by deductive logic, so we trust the conclusion — that the purely random is predictable. Not in the way that lets us say how a ball will bounce off the floor. In the way that we can describe the shape of a great number of grains of sand dropped slowly on the floor.
The trick is one we might get if we were bad at darts. If we toss darts at a dartboard, badly, some will land on the board and some on the wall behind. How many hit the dartboard, compared to the total number we throw? If we’re as likely to hit every spot of the wall, then the fraction that hit the dartboard, times the area of the wall, should be about the area of the dartboard.
So we can do something equivalent to this dart-throwing to find the volumes of these complicated, hyper-dimensional shapes. It’s a kind of numerical integration. It isn’t particularly sensitive to how complicated the shape is, though. It takes more work to find the volume of a shape with more dimensions, yes. But it takes less more-work than the breaking-up-into-known-shapes method does. There are wide swaths of mathematics and mathematical physics where this is the best way to calculate the integral.
This bit that I’ve described is called “Monte Carlo integration”. The “integration” part of the name because that’s what we started out doing. To call it “Monte Carlo” implies either the method was first developed there or the person naming it was thinking of the famous casinos. The case is the latter. Monte Carlo methods as we know them come from Stanislaw Ulam, mathematical physicist working on atomic weapon design. While ill, he got to playing the game of Canfield solitaire, about which I know nothing except that Stanislaw Ulam was playing it in 1946 while ill. He wondered what the chance was that a given game was winnable. The most practical approach was sampling: set a computer to play a great many games and see what fractions of them were won. (The method comes from Ulam and John von Neumann. The name itself comes from their colleague Nicholas Metropolis.)
There are many Monte Carlo methods, with integration being only one very useful one. They hold in common that they’re build on randomness. We try calculations — often simple ones — many times over with many different possible values. And the regularity, the predictability, of randomness serves us. The results come together to an average that is close to the thing we do want to know.
My friend ChefMongoose pointed out this probability question. As with many probability questions, it comes from a dice game. Here, Yahtzee, based on rolling five dice to make combinations. I’m not sure whether my Twitter problems will get in the way of this embedding working; we’ll see.
Probability help please! You are playing Yahtzee against your insanely competitive spouse. You have two rolls left. You’re trying to get three of a kind. Is it better to commit and roll three dice here? Or split it and roll one die? pic.twitter.com/fi85UYUTUv
Probability help please! You are playing Yahtzee against your insanely competitive spouse. You have two rolls left. You’re trying to get three of a kind. Is it better to commit and roll three dice here? Or split it and roll one die? — Christopher Yost.
Of the five dice, two are showing 1’s; two are showing 2’s; and there’s one last die that’s a 3.
As with many dice questions you can in principle work this out by listing all the possible combinations of every possible outcome. A bit of reasoning takes much less work, but you have to think through the reasons.
Today (the 26th of November) is the Thanksgiving holiday in the United States. The holiday’s set, by law since 1941, to the fourth Thursday in November. (Before then it was customarily the last Thursday in November, but set by Presidential declaration. After Franklin Delano Roosevelt set the holiday to the third Thursday in November, to extend the 1939 and 1940 Christmas-shopping seasons — a decision Republican Alf Landon characterized as Hitlerian — the fourth Thursday was encoded in law.)
Any know-it-all will tell you, though, how the 13th of the month is very slightly more likely to be a Friday than any other day of the week. This is because the Gregorian calendar has that peculiar century-year leap day rule. It throws off the regular progression of the dates through the week. It takes 400 years for the calendar to start repeating itself. How does this affect the fourth Thursday of November? (A month which, this year, did have a Friday the 13th.)
It turns out, it changes things in subtle ways. Thanksgiving, by the current rule, can be any date between the 22nd and 28th; it’s most likely to be any of the 22nd, 24th, or 26th. (This implies that the 13th of November is equally likely to be a Friday, Wednesday, or Monday, a result that surprises me too.) So here’s how often which date is Thanksgiving. This if we pretend the current United States definition of Thanksgiving will be in force for 400 years unchanged:
This is the 141st Playful Math Education Blog Carnival. And I will be taking this lower-key than I have past times I was able to host the carnival. I do not have higher keys available this year.
The Numbers
I will start by borrowing a page from Iva Sallay, kind creator and host of FindTheFactors.com, and say some things about 141. I owe Iva Sallay many things, including this comfortable lead-in to the post, and my participation in the Playful Math Education Blog Carnival. She was also kind enough to send me many interesting blogs and pages and I am grateful.
141 is a centered pentagonal number. It’s like 1 or 6 or 16 that way. That is, if I give you six pennies and ask you to do something with it, a natural thing is one coin in the center and a pentagon around that. With 16 coins, you can add a nice regular pentagon around that, one that reaches three coins from vertex to vertex. 31, 51, 76, and 106 are the next couple centered pentagonal numbers. 181 and 226 are the next centered pentagonal numbers. The units number in these follow a pattern, too, in base ten. The last digits go 1-6-6-1, 1-6-6-1, 1-6-6-1, and so on.
141’s also a hendecagonal number. That is, arrange your coins to make a regular 11-sided polygon. 1 and then 11 are hendecagonal numbers. Then 30, 58, 95, and 141. 196 and 260 are the next couple. There are many of these sorts of polygonal numbers, for any regular polygon you like.
141 is also a Hilbert Prime, a class of number I hadn’t heard of before. It’s still named for the Hilbert of Hilbert’s problems. 141 is not a prime number, which you notice from adding up the digits. But a Hilbert Prime is a different kind of beast. These come from looking at counting numbers that are one more than a whole multiple of four. So, numbers like 1, 5, 9, 13, and so on. This sequence describes a lot of classes of numbers. A Hilbert Prime, at least as some number theorists use it, is a Hilbert Number that can’t be divided by any other Hilbert Number (other than 1). So these include 5, 9, 13, 17, and 21, and some of those are already not traditional primes. There are Hilbert Numbers that are the products of different sets of Hilbert Primes, such as 441 or 693. (441 is both 21 times 21 and also 9 times 49. 693 is 9 times 77 and also 21 times 33) So I don’t know what use Hilbert Primes are specifically. If someone knows, I’d love to hear.
Second round of overflow parking at Dorney Park. From a visit we took in August of 2014, you remember, that day everybody in eastern Pennsylvania, north Jersey, and southern New York State decided to go to Dorney Park. All these amusement park pictures are ones I’ve taken and I’m happy to say, truthfully, that they’re all connected to something in the main text.
Also, at the risk of causing trouble, The Aperiodical also hosts a monthly Carnival of Mathematics. It’s a similar gathering of interesting mathematics content. It doesn’t look necessarily for educational or playful pieces.
The Reflective Educator posted Precision In Language. This is about one of the hardest bits of teaching. That is to say things which are true and which can’t be mis-remembered as something false. Author David Wees points out an example of this hazard, as kids apply rules outside their context.
Simon Gregg’s essay The Gardener and the Carpenter follows a connected theme. The experience students have with a thing can be different depending on how the teacher presents it. The lead example of Gregg’s essay is about the different ways students played with a toy depending on how the teacher prompted them to explore it.
Also crossing my desk this month was a couple-year-old article Melinda D Anderson published in The Atlantic. How Does Race Affect a Student’s Math Education? Mathematics affects a pose of being a culturally-independent, value-neutral study. The conclusions it draws might be. But what we choose to study, and how we choose to study it, is not. And how we teach it is socially biased and determined. So here are thoughts about that.
Lift hill for Thunderhawk, Dorney Park’s antique wooden roller coaster. Behind it, if I’ve got this right, is Steel Force, a much taller steel coaster. Photo from August 2014.
Emelina Minero offered 8 Strategies to Improve Participation in Your Virtual Classroom. Class participation was always the most challenging part of my teaching, when I did any of that, and this was face-to-face. Online is a different experience, with different challenges. That there is usually the main channel of voice chat and the side channel of text offers new ways to get people to share, though.
S Leigh Nataro, of the MathTeacher24 blog, writes Learning Math is Social: We Are in This Together. Many teachers have gotten administrative guidance that … doesn’t … guide well. The easy joke is to say it never did. But the practical bits of most educational strategies we learn from long experience. There’s no comparable experience here. What are ways to reduce the size of the crisis? Nataro has thoughts.
Enlightenment
Now I can come to more bundles of things to teach. Colleen Young gathered Maths at school … and at home, bundles of exercises and practice sheets. One of the geometry puzzles, about the missing lengths in the perimeter of a hexagon, brings me a smile as this is a sort of work I’ve been doing for my day job.
Starting Points Maths has a page of Radian Measure — Intro. The goal here is building comfort in the use of radians as angle measure. Mathematicians tend to think in radians. The trigonometric functions for radian measure behave well. Derivatives and integrals are easy, for example. We do a lot of derivatives and integrals. The measures look stranger, is all, especially as they almost always involve fractions times π.
(Children’s) swing ride at Seabreeze Park in Rochester, New York (2019). It was a cool day when we visited.
The Google Images picture gallery How Many? offers a soothing and self-directed counting puzzle. Each picture is a collection of things. How to count them, and even what you choose to count, is yours to judge.
Miss Konstantine of MathsHKO posted Area (Equal — Pythagorean Triples). Miss Konstantine had started with Pythagorean triplets, sets of numbers that can be the legs of a right triangle. And then explored other families of shapes that can have equal areas, including looking to circles and rings.
Lowry also has Helping Your Child Learn Time, using both analog and digital clocks. That lets me mention a recent discussion with my love, who teaches. My love’s students were not getting the argument that analog clocks can offer a better sense of how time is elapsing. I had what I think a compelling argument: an analog clock is like a health bar, a digital clock like the count of hit points. Logic tells me this will communicate well.
YummyMath’s Fall Equinox 2020 describes some of the geometry of the equinoxes. It also offers questions about how to calculate the time of daylight given one’s position on the Earth. This is one of the great historic and practical uses for trigonometry.
Games
To some play! Miguel Barral wrote Much More Than a Diversion: The Mathematics of Solitaire. There are many kinds of solitaire, which is ultimately just a game that can be played alone. They’re all subject to study through game theory. And to questions like “what is the chance of winning”? That’s often a question best answered by computer simulation. Working out that challenge helped create Monte Carlo methods. These can find approximate solutions to problems too difficult to find perfect solutions for.
Conditional probability is fun. It’s full of questions easy to present and contradicting intuition to solve. Wayne Chadburn’s Big Question explores one of them. It’s based on a problem which went viral a couple years ago, called “Hannah’s Sweet”. I missed the problem when it was getting people mad. But Chadburn explores how to think through the problem.
A column of horses at Cedar Point (Ohio)’s Cedar Downs, a racing merry-go-round. The horses move forward and backward in those slots. Also the carousel moves fast, which makes it much better. (October 2019.)
Now to some deeper personal interests. I am an amusement park enthusiast: I’ve ridden at least 250 different roller coasters at least once each. This includes all the wooden Möbius-strip roller coasters out there. Also all three racing merry-go-rounds. The oldest roller coaster still standing. And I had hoped, this year, to get to the centennial years for the Jackrabbit roller coaster at Kennywood Amusement Park (Pittsburgh) and Jack Rabbit roller coaster at Seabreeze Park (Rochester, New York). Jackrabbit (with spelling variants) used to be a quite popular roller coaster name.
So plans went awry and it seems unlikely we’ll get to any amusement parks this year. No county fairs or carnivals. We can still go to virtual ones, though. Amusement parks and midway games inspire many mathematical questions. So let’s take some in.
Michigan State University’s Connected Mathematics Program set up set up a string of carnival-style games. The event’s planners figured on then turning the play money into prize raffles but you can also play games. Some are legitimate midway games, such as plinko, spinner wheels, or racing games, too.
Resource Area For Teaching’s Carnival Math offers for preschool through grade six a semi-practical carnival game. There’s different goals for different education levels.
Hooda Math’s Carnival Fun offers a series of games, many of them Flash, a fair number HTML5, and mostly for kindergraden through 8th grade. There are a lot of mathematics games here, along with some physics and word games.
Some midway gaves on offer at Seabreeze Park in Rochester, New York (2019). It was a slow day and the park had just opened minutes before.
Specific rides, though, are always beautiful and worth looking at. Ann-Marie Pendrill’s Rotating swings—a theme with variations looks at rotating swing rides. These have many kinds of motion and many can be turned into educational problems. Pendrill looks at some of them. There are other articles recommended by this, which seem relevant, but this was the only article I found which I had permission to read in full. Your institution might have better access.
Lin McMullin’s The Scrambler, or A Family of Vectors at the Amusement Park looks at the motion of the most popular thrill ride out there. (There are more intense rides. But they’re also ones many people feel are too much for them. Few people in a population think the Scrambler is too much for them.) McMullin uses the language of vectors to examine what path the rider traces out during a ride, and what they say about velocity and acceleration. These are all some wonderful shapes.
You may have wondered on a Scrambler ride how long it takes to get back to the same ground position. The answer is that it depends on just how the pieces rotate. (Lakeside Park, Denver, visited in June 2018.)
And Amusement Parks
Many amusement parks host science and mathematics education days. In fact I’ve never gone to the opening day of my home park, Michigan’s Adventure, as that’s a short four-hour day filled with area kids. Many of the parks do have activity pages, though, suggesting the kinds of things to think about at a park. Some of the mathematics is things one can use; some is toying with curiosity.
Here’s The State Fair of Texas’s Grade 6 STEM games. I don’t know whether there’s a more recent edition. But also imagine that tasks like counting the traffic flow or thinking about what energies are shown at different times in a ride do not age.
Dorney Park’s antique carousel, which at one time turned in the small Lake Lansing Amusement Park. Photo from August 2014.
Dorney Park, in northeastern Pennsylvania, was never my home park, but it was close. And I’ve had the chance to visit several times. People with Kutztown University, regional high schools, and Dorney Park prepared Coaster Quest – Geometry. These include a lot of observations and measurements all tied to specific rides at the park. (And a side fact, fun for me: Dorney Park’s carousel used to be at Lake Lansing Amusement Park, a few miles from me. Lake Lansing’s park closed in 1972, and the carousel spent several decades at Cedar Point in Ohio before moving to Pennsylvania. The old carousel building at Lake Lansing still stands, though, and I happened to be there a few weeks ago.)
A 2018 posting on Social Mathematics asks: Do height restrictions matter to safety on Roller Coasters? Of course they do, or else we’d have more roller coasters that allowed mice to ride. The question is how much the size restriction matters, and how sensitive that dependence is. So the leading question is a classic example of applying mathematics to the real world. This includes practical subtleties like if a person 39.5 inches tall could ride safely, is it fair to round that off to 40 inches? It also includes the struggle to work out how dangerous an amusement park is.
Speaking from my experience as a rider and lover of amusement parks: don’t try to plead someone’s “close enough”. You’re putting an unfair burden on the ride operator. Accept the rules as posted. Everybody who loves amusement parks has their disappointment stories; accept yours in good grace.
Kingda Ka, Rolling Thunder, and El Toro, side by side. Rolling Thunder, itself a racing roller coaster, has since been torn down. Rolling Thunder’s greatest height was 96 feet, on both sides of the train. (Photo from July 2013.)
This leads me into planning amusement park fun. School Specialty’s blog particularly offers PLAY & PLAN: Amusement Park. This is a guide to building an amusement park activity packet for any primary school level. It includes, by the way, some mention of the historical and cultural aspects. That falls outside my focus on mathematics with a side of science here. But there is a wealth of culture in amusement parks, in their rides, their attractions, and their policies.
And to step away from the fun a moment. Many aspects of the struggle to bring equality to Americans are reflected in amusement parks, or were fought by proxy in them. This is some serious matter, and is challenging to teach. Few amusement parks would mention segregation or racist attractions or policies except elliptically. (That midway game where you throw a ball at a clown’s face? The person taking the hit was not always a clown.) Claire Prentice’s The Lost Tribe of Coney Island: Headhunters, Luna Park, and the Man Who Pulled Off the Spectacle of the Century is a book I recommend. It reflects one slice of this history.
Let me resume the fun, by looking to imaginary amusement parks. TeachEngineering’s Amusement Park Ride: Ups and Downs in Design designs and builds model “roller coasters”. This from foam tubes, toothpicks, masking tape, and marbles. It’s easier to build a ride in Roller Coaster Tycoon but that will always lack some of the thrill of having a real thing that doesn’t quite do what you want. The builders of Son Of Beast had the same frustration.
The Brunswick (Ohio) City Schools published a nice Amusement Park Map Project. It also introduces students to coordinate systems. This by having them lay out and design their own amusement park. It includes introductions to basic shapes. I am surprised reading the requirements that merry-go-rounds aren’t included, as circles. I am delighted that the plan calls for eight to ten roller coasters and a petting zoo, though. That plan works for me.
One natural question is: does the order matter? Are you better off going first, second, or third? Contestants don’t get to choose order; they’re ranked by how much they’ve won on the show already. (I believe this includes the value of their One-Bids, the item-up-for-bid that gets them on stage. This lets them rank contestants when all three lost their pricing games.) The first contestant always has a choice of whether to spin once or twice. The second and third contestants don’t necessarily get to choose what to do. Is that an advantage or a disadvantage?
In this paper, published 2002, Tenorio and Cason look at the game-theoretical logic. And compare it to how people actually play the game, on the show and in laboratory experiments. (The advantage of laboratory experiments, besides that you can get more than two each day, is that participants’ behavior won’t be thrown off by the thoughts of winning a thousand or more dollars for a good spin.) They also look some at how the psychology of risk affects people’s play.
(I’m compelled — literally, I can’t help myself — to note they make some terminology errors. They mis-label the Showcase Showdown as the bit at the end of the show, where two contestants put up bids for showcases. It’s a common mistake, and probably reflects that “showdown” has connotations of being one-on-one. But that segment is simply the Showcase Round. The Showcase Showdown is the spinning-the-big-wheel part.)
Their research, anyway, suggests that if every contestant played perfectly — achieving a “Nash equilibrium”, in which nobody can pick a better strategy given the choices other players make — going later does, indeed, give a slight advantage. The first contestant would win about 31% of the time, the second about 33%, and the third about 36% of the time. In watching the show to see what happens they found the first contestant won about 30% of the time, the second about 34%, and the third about 36% of the time. That’s no big difference.
The article includes more fascinating statistical breakdowns, answering questions such as “are spins on the wheel uniformly distributed?” That is, are you as likely to spin $1.00 on the first spin as you are to spin 0.05? Or 0.50? They have records of what people actually do. Or what prize payouts would be expected, from theoretical perfect play, and how they compare to actual play.
The paper is written for an academic audience, particularly one versed in game theory. If you are somehow not, it can be tough going. It’s all right to let your eye zip past a paragraph of jargon, or of calculations, to get back to the parts that read as English. Real mathematicians do that too, as a way of understanding the point. They can come back around later to learn how the authors got to the point.
The past week had a fair number of comic strips mentioning some aspect of mathematics. One of them is, really, fairly slight. But it extends a thread in the comic strip that I like and so that I will feature here.
Sam Hurt’s Eyebeam for the 11th uses heaps of mathematical expressions, graphs, charts, and Venn diagrams to represent the concept of “data”. It’s spilled all over to represent “sloppy data”. Usually by the term we mean data that we feel is unreliable. Measurements that are imprecise, or that are unlikely to be reliable. Precision is, roughly, how many significant digits your measurement has. Reliability is, roughly, if you repeated the measurement would you get about the same number?
Ryan North’s Dinosaur Comics for the 12th talks about immortality. And what the probability of events means when there are infinitely many opportunities for a thing to happen.
We’re accustomed in probability to thinking of the expectation value. This is the chance that something will happen, given some number N opportunities to happen, if at each opportunity it has the probability p of happening. Let me assume the probability is always the same number. If it’s not, our work gets harder, although it’s basically the same kind of work. But, then, the expectation value, the number of times we’d expect to see the thing happen, is N times p. Which, as Utahraptor points out, we can expect has to be at least 1 for any event, however unlikely, given enough chances. So it should be.
But, then, to take Utahraptor’s example: what is the probability that an immortal being never trips down the stairs? At least not badly enough to do harm? Why should we think that’s zero? It’s not as if there’s a physical law that compels someone to go to stairs and then to fall down them to their death. And, if there’s any nonzero chance of someone not dying this way? Then, if there are enough immortals, there’s someone who will go forever without falling down stairs.
That covers just the one way to die, of course. But the same reasoning holds for every possible way to die. If there’s enough immortals, there’s someone who would not die from falling down stairs and from never being struck by a meteor. And someone who’d never fall down stairs and never be struck by a meteor and never fall off a cliff trying to drop an anvil on a roadrunner. And so on. If there are infinitely many people, there’s at least one who’d avoid all possible accidental causes of death.
More. If there’s infinitely many immortals, then there are going to be a second and a third — indeed, an infinite number — of people who happen to be lucky enough to never die from anything. Infinitely many immortals die of accidents, sure, but somehow not all of them. We can’t even say that more immortals die of accidents than don’t.
My point is that probability gets really weird when you try putting infinities into it. Proceed with extreme caution. But the results of basic, incautious, thinking can be quite heady.
Bill Amend’s FoxTrot Classics for the 12th has Paige cramming for a geometry exam. Don’t cram for exams; it really doesn’t work. It’s regular steady relaxed studying that you need. That and rest. There is nothing you do that you do better for being sleep-deprived.
Bob Weber Jr and Jay Stephens’s Oh Brother for the 12th has Lily tease her brother with a story problem. I believe the strip’s a rerun, but it had been gone altogether for more than a year. It’s nice to see it returned anyway.
The 22nd of March is the least probable date for Easter. That date was last Easter in 1818, and will next be Easter in 2285. The 12th of April, though? That’s one of the most likely dates for Easter. To say what is “the” most probable date for Easter requires some thought. First, what it means to talk about the chance of an algorithmically defined quantity. Second, what it means to look at Easter. The holiday is intended to happen early in the European spring. But the start of European spring is moving through the calendar. Someday we will abandon the Gregorian calendar, or radically change the calculation of Easter. This makes it harder to say how often each possible date turns up. But we can make some rough answers.
The 15th of April is the most probable date for Easter, if we look at a 532-year span. (There are astronomical reasons to look at 532 years.) If we look at a more limited stretch, 1925 to 2100, on the assumption that that’s the maximum spread of dates that anyone alive today can be expected to see, then we have ten dates equally common, the 12th of April among them.
With this essay, I finally finish the comic strips from the first full week of February. You know how these things happen. I’ll get to the comics from last week soon enough, at an essay gathered under this link. For now, some pictures with words:
Art Sansom and Chip Sansom’s The Born Loser for the 7th builds on one of the probability questions people often use. That is the probability of an event, in the weather forecast. Predictions for what the weather will do are so common that it takes work to realize there’s something difficult about the concept. The weather is a very complicated fluid-dynamics problem. It’s almost certainly chaotic. A chaotic system is deterministic, but unpredictable, because to get a meaningful prediction requires precision that’s impossible to ever have in the real world. The slight difference between the number π and the number 3.1415926535897932 throws calculations off too quickly. Nevertheless, it implies that the “chance” of snow on the weekend means about the same thing as the “chance” that Valentinte’s Day was on the weekend this year. The way the system is set up implies it will be one or the other. This is a probability distribution, yes, but it’s a weird one.
What we talk about when we say the “chance” of snow or Valentine’s on a weekend day is one of ignorance. It’s about our estimate that the true value of something is one of the properties we find interesting. Here, past knowledge can guide us. If we know that the past hundred times the weather was like this on Friday, snow came on the weekend less than ten times, we have evidence that suggests these conditions don’t often lead to snow. This is backed up, these days, by numerical simulations which are not perfect models of the weather. But they are ones that represent something very like the weather, and that stay reasonably good for several days or a week or so.
And we have the question of whether the forecast is right. Observing this fact is used as the joke here. Still, there must be some measure of confidence in a forecast. Around here, the weather forecast is for a cold but not abnormally cold week ahead. This seems likely. A forecast that it was to jump into the 80s and stay there for the rest of February would be so implausible that we’d ignore it altogether. A forecast that it would be ten degrees (Fahrenheit) below normal, or above, though? We could accept that pretty easily.
Proving a forecast is wrong takes work, though. Mostly it takes evidence. If we look at a hundred times the forecast was for a 10% chance of snow, and it actually snowed 11% of the time, is it implausible that the forecast was right? Not really, not any more than a coin coming up tails 52 times out of 100 would be suspicious. If it actually snowed 20% of the time? That might suggest that the forecast was wrong. If it snowed 80% of the time? That suggests something’s very wrong with the forecasting methods. It’s hard to say one forecast is wrong, but we can have a sense of what forecasters are more often right than others are.
Doug Savage’s Savage Chickens for the 7th is a cute little bit about counting. Counting things out is an interesting process; for some people, hearing numbers said aloud will disrupt their progress. For others, it won’t, but seeing numbers may disrupt it instead.
Niklas Eriksson’s Carpe Diem for the 8th is a bit of silliness about the mathematical sense of animals. Studying how animals understand number is a real science, and it turns up interesting results. It shouldn’t be surprising that animals can do a fair bit of counting and some geometric reasoning, although it’s rougher than even our untrained childhood expertise. We get a good bit of our basic mathematical ability from somewhere, because we’re evolved to notice some things. It’s silly to suppose that dogs would be able to state the Pythagorean Theorem, at least in a form that we recognize. But it is probably someone’s good research problem to work out whether we can test whether dogs understand the implications of the theorem, and whether it helps them go about dog work any.
Zach Weinersmith’s Saturday Morning Breakfast Cereal for the 8th speaks of the “Cinnamon Roll Delta Function”. The point is clear enough on its own. So let me spoil a good enough bit of fluff by explaining that it’s a reference to something. There is, lurking in mathematical physics, a concept called the “Dirac delta function”, named for that innovative and imaginative fellow Paul Dirac. It has some weird properties. Its domain is … well, it has many domains. The real numbers. The set of ordered pairs of real numbers, R2. The set of ordered triples of real numbers, R3. Basically any space you like, there’s a Dirac delta function for it. The Dirac delta function is equal to zero everywhere in this domain, except at one point, the “origin”. At that one function, though? There it’s equal to …
Here we step back a moment. We really, really, really want to say that it’s infinitely large at that point, which is what Weinersmith’s graph shows. If we’re being careful, we don’t say that though. Because if we did say that, then we would lose the thing that we use the Dirac delta function for. The Dirac delta function, represented with δ, is a function with the property that for any set D, in the domain, that you choose to integrate over
whenever the origin is inside the interval of integration D. It’s equal to 0 if the origin is not inside the interval of integration. This, whatever the set is. If we use the ordinary definitions for what it means to integrate a function, and say that the delta function is “infinitely big” at the origin, then this won’t happen; the integral will be zero everywhere.
This is one of those cases where physicists worked out new mathematical concepts, and the mathematicians had to come up with a rationalization by which this made sense. This because the function is quite useful. It allows us, mathematically, to turn descriptions of point particles into descriptions of continuous fields. And vice-versa: we can turn continuous fields into point particles. It turns out we like to do this a lot. So if we’re being careful we don’t say just what the Dirac delta function “is” at the origin, only some properties about what it does. And if we’re being further careful we’ll speak of it as a “distribution” rather than a function.
But colloquially, we think of the Dirac delta function as one that’s zero everywhere, except for the one point where it’s somehow “a really big infinity” and we try to not look directly at it.
The sharp-eyed observer may notice that Weinersmith’s graph does not put the great delta spike at the origin, that is, where the x-axis represents zero. This is true. We can create a delta-like function with a singular spot anywhere we like by the process called “translation”. That is, if we would like the function to be zero everywhere except at the point , then we define a function and are done. Translation is a simple step, but it turns out to be useful all the time.
Besides kids doing homework there were a good ten or so comic strips with enough mathematical content for me to discuss. So let me split that over a couple of days; I don’t have the time to do them all in one big essay.
Sandra Bell-Lundy’s Between Friends for the 2nd is declared to be a Venn Diagram joke. As longtime readers of these columns know, it’s actually an Euler Diagram: a Venn Diagram requires some area of overlap between all combinations of the various sets. Two circles that never touch, or as these two do touch at a point, don’t count. They do qualify as Euler Diagrams, which have looser construction requirements. But everything’s named for Euler, so that’s a less clear identifier.
John Kovaleski’s Daddy Daze for the 2nd talks about probability. Particularly about the probability of guessing someone’s birthday. This is going to be about one chance in 365, or 366 in leap years. Birthdays are not perfectly uniformly distributed through the year. The 13th is less likely than other days in the month for someone to be born; this surely reflects a reluctance to induce birth on an unlucky day. Births are marginally more likely in September than in other months of the year; this surely reflects something having people in a merry-making mood in December. These are tiny effects, though, and to guess any day has about one chance in 365 of being someone’s birthday will be close enough.
If the child does this long enough there’s almost sure to be a match of person and birthday. It’s not guaranteed in the first 365 cards given out, or even the first 730, or more. But, if the birthdays of passers-by are independent — one pedestrian’s birthday has nothing to do with the next’s — then, overall, about one-365th of all cards will go to someone whose birthday it is. (This also supposes that we won’t see things like the person picked saying that while it’s not their birthday, it is their friend’s, here.) This, the Law of Large Numbers, one of the cornerstones of probability, guarantees us.
Mark Anderson’s Andertoons for the 2nd is the Mark Anderson’s Andertoons for the week. And it’s a Venn Diagram joke, at least if the two circles are “really” there. Diplopia is what most of us would call double vision, seeing multiple offset copies of a thing. So the Venn diagram might be an optical illusion on the part of the businessman and the reader.
Dave Blazek’s Loose Parts for the 3rd is an anthropomorphic mathematical symbols joke. I suppose it’s algebraic symbols. We usually get to see the ‘x’ and ‘y’ axes in (high school) algebra, used to differentiate two orthogonal axes. The axes can be named anything. If ‘x’ and ‘y’ won’t do, we might move to using and . In linear algebra, when we might want to think about Euclidean spaces with possibly enormously many dimensions, we may change the names to and . (We could use subscripts of 0 and 1, although I do not remember ever seeing someone do that.)
Morrie Turner’s Wee Pals for the 3rd is a repeat, of course. Turner died several years ago and no one continued the strip. But it is also a repeat that I have discussed in these essays before, which likely makes this a good reason to drop Wee Pals from my regular reading here. There are 42 distinct ways to add (positive) whole numbers up to make ten, when you remember that you can add three or four or even six numbers together to do it. The study of how many different ways to make the same sum is a problem of partitioning. This might not seem very interesting, but if you try to guess how many ways there are to add up to 9 or 11 or 15, you’ll notice it’s a harder problem than it appears.
And for all that, there’s still some more comic strips to review. I will probably slot those in to Sunday, and start taking care of this current week’s comic strips on … probably Tuesday. Please check in at this link Sunday, and Tuesday, and we’ll see what I do.
Let me first share the other comic strips from last week which mentioned mathematics, but in a casual way.
Jerry Scott and Jim Borgman’s Zits for the 14th used the phrase “do the math”, and snarked on the younger generation doing mathematics. This was as part of the longrunning comic’s attempt to retcon the parents from being Baby Boomers to being Generation X. Scott and Borgman can do as they like but, I mean, their kids are named Chad and Jeremy. That’s only tenable if they’re Boomers. (I’m not sure Chad has returned from college in the past ten years.) And even then it was marginal.
So Mark Anderson’s Andertoons for the 12th is the only comic strip of some substance that I noticed last week. You see what a slender month it’s been. It does showcase the unsettling nature of seeing notations for similar things mixed. It’s not that there’s anything which doesn’t parse about having decimals in the numerator or denominator. It just looks weird. And that can be enough to throw someone out of a problem. They might mistake the problem for one that doesn’t have a coherent meaning. Or they might mistake it for one too complicated to do. Learning to not be afraid of a problem that looks complicated is worth doing. As is learning how to tell whether a problem parses at all, even if it looks weird.
And here’s the rest of last week’s mathematically-themed comic strips. On reflection, none of them are so substantially about the mathematics they mention for me to go into detail. Again, Comic Strip Master Command is helping me rebuild my energies after the A-to-Z wrapped up. I appreciate it, folks, but would like, you know, two or three strips a week I can sink my teeth into.
Charles Schulz’s Peanuts rerun for the 11th sees Sally Brown working out metric system unit conversions. The strip originally ran the 13th of December, 1972, a year when people in the United States briefly thought there might ever be a reason to use the prefix “deci-” for something besides decibels. “centi-” for anything besides “centimeter” is pretty dodgy too.
Rick Detorie’s One Big Happy for the 13th is a strip about percentages, and the question of whether a percentage over 100 can be meaningful. I’m solidly in the camp that says “of course it can be”.
Zach Weinersmith’s Saturday Morning Breakfast Cereal for the 13th is titled “Do Not Date A Mathematician”. This seems personal. The point here is the mathematician believing her fiancee has “demonstrated a poor understanding of probability” by declaring his belief in soulmates. The joke seems to be missing some key points, though. Just declaring a belief in soulmates doesn’t say anything about his understanding of probability. If we suppose that he believed every person had exactly one soulmate, and that these soulmates were uniformly distributed across the world’s population, and that people routinely found their soulmates. But if those assumptions aren’t made then you can’t say that the fiancee is necessarily believing in something improbable.
The sample space is a tool for probability questions. We need them. Humans are bad at probability questions. Thinking of sample spaces helps us. It’s a way to recast probability questions so that our intuitions about space — which are pretty good — will guide us to probabilities.
A sample space collects the possible results of some experiment. “Experiment” means what way mathematicians intend, so, not something with test tubes and colorful liquids that might blow up. Instead it’s things like tossing coins and dice and pulling cards out of reduced decks. At least while we’re learning. In real mathematical work this turns into more varied stuff. Fluid flows or magnetic field strengths or economic forecasts. The experiment is the doing of something which gives us information. This information is the result of flipping this coin or drawing this card or measuring this wind speed. Once we know the information, that’s the outcome.
So each possible outcome we represent as a point in the sample space. Describing it as a “space” might cause trouble. “Space” carries connotations of something three-dimensional and continuous and contiguous. This isn’t necessarily so. We can be interested in discrete outcomes. A coin’s toss has two possible outcomes. Three, if we count losing the coin. The day of the week on which someone’s birthday falls has seven possible outcomes. We can also be interested in continuous outcomes. The amount of rain over the day is some nonnegative real number. The amount of time spent waiting at this traffic light is some nonnegative real number. We’re often interested in discrete representations of something continuous. We did not have inches of rain overnight, even if we did. We recorded 0.71 inches after the storm.
We don’t demand every point in the sample space to be equally probable. There seems to be a circularity to requiring that. What we do demand is that the sample space be a “sigma algebra”, or σ-algebra to write it briefly. I don’t know how σ came to be the shorthand for this kind of algebra. Here “algebra” means a thing with a bunch of rules. These rules are about what you’d guess if you read pop mathematics blogs and had to bluff your way through a conversation of rules about sets. The algebra’s this collection of sets made up of the elements of X. Subsets of this algebra have to be contained in this collection. Their complements are also sets in the collection. The unions of sets have to be in the collection.
So the sample space is a set. All the possible outcomes of the experiment we’re thinking about are its elements. Every experiment must have some outcome that’s inside the sample space. And any two different outcomes have to be mutually exclusive. That is, if outcome A has happened, then outcome B has not happened. And vice-versa; I’m not so fond of A that I would refuse B.
I see your protest. You’ve worked through probability homework problems where you’re asked the chance a card drawn from this deck is either a face card or a diamond. The jack of diamonds is both. This is true; but it’s not what we’re looking at. The outcome of this experiment is the card that’s drawn, which might be any of 52 options.
If you like treating it that way. You might build the sample space differently, like saying that it’s an ordered pair. One part of the pair is the suit of the card. The other part is the value. This might be better for the problem you’re doing. This is part of why the probability department commands such high wages. There are many sample spaces that can describe the problem you’re interested in. This does include one where one event is “draw a card that’s a face card or diamond” and the other is “draw one that isn’t”. (These events don’t have an equal probability.) The work is finding a sample space that clarifies your problem.
Working out the sample space that clarifies the problem is the hard part, usually. Not being rigorous about the space gives us many probability paradoxes. You know, like the puzzle where you’re told someone’s two children are either boys or girls. One walks in and it’s a girl. You’re told the probability the other is a boy is two-thirds. And you get mad. Or the Monty Hall Paradox, where you’re asked to pick which of three doors has the grand prize behind it. You’re shown one that you didn’t pick which hasn’t. You’re given the chance to switch to the remaining door. You’re told the probability that the grand prize is behind that other door is two-thirds, and you get mad. There are probability paradoxes that don’t involve a chance of two-thirds. Having a clear idea of the sample space avoids getting the answers wrong, at least. There’s not much to do about not getting mad.
Like I said, we don’t insist that every point in the sample space have an equal probability of being the outcome. Or, if it’s a continuous space, that every region of the same area has the same probability. It is certainly easier if it does. Then finding the probability of some result becomes easy. You count the number of outcomes that satisfy that result, and divide by the total number of outcomes. You see this in problems about throwing two dice and asking the chance the total is seven, or five, or twelve.
For a continuous sample space, you’d find the area of all the results that satisfy the result. Divide that by the area of the sample space and there’s the probability of that result. (It’s possible for a result to have an area of zero, which implies that the thing cannot happen. This presents a paradox. A thing is in the sample space because it is a possible outcome. What these measure-zero results are, typically, is something like every one of infinitely many tossed coins coming up tails. That can’t happen, but it’s not like there’s any reason it can’t.)
If every outcome isn’t equally likely, though? Sometimes we can redesign the sample space to something that is. The result of rolling two dice is a familiar example. The chance of the dice totalling 2 is different from the chance of them totalling 4. So a sample space that’s just the sums, the numbers 2 through 12, is annoying to deal with. But rewrite the space as the ordered pairs, the result of die one and die two? Then we have something nice. The chance of die one being 1 and die two being 1 is the same as the chance of die one being 2 and die two being 2. There happen to be other die combinations that add up to 4 is all.
Sometimes there’s no finding a sample space which describes what you’re interested in and that makes every point equally probable. Or nearly enough. The world is vast and complicated. That’s all right. We can have a function that describes, for each point in the sample space, the probability of its turning up. Really we had that already, for equally-probable outcomes. It’s just that was all the same number. But this function is called the probability measure. If we combine together a sample space, and a collection of all the events we’re interested in, and a probability measure for all these events, then this triad is a probability space.
And probability spaces give us all sorts of great possibilities. Dearest to my own work is Monte Carlo methods, in which we look for particular points inside the sample space. We do this by starting out anywhere, picking a point at random. And then try moving to a different point, picking the “direction” of the change at random. We decide whether that move succeeds by a rule that depends in part on the probability measure, and in part on how well whatever we’re looking for holds true. This is a scheme that demands a lot of calculation. You won’t be surprised that it only became a serious tool once computing power was abundant.
So for many problems there is no actually listing all the sample space. A real problem might include, say, the up-or-down orientation of millions of magnets. This is a sample space of unspeakable vastness. But thinking out this space, and what it must look like, helps these probability questions become ones that our intuitions help us with instead. If you do not know what to do with a probability question, think to the sample spaces.
I knew by Thursday this would be a brief week. The number of mathematically-themed comic strips has been tiny. I’m not upset, as the days turned surprisingly full on me once again. At some point I would have to stop being surprised that every week is busier than I expect, right?
Anyway, the week gives me plenty of chances to look back to 1936, which is great fun for people who didn’t have to live through 1936.
Elzie Segar’s Thimble Theatre rerun for the 28th of October is part of the story introducing Eugene the Jeep. The Jeep has astounding powers which, here, are finally explained as being due to it being a fourth-dimensional creature. Or at least able to move into the fourth dimension. This is amazing for how it shows off the fourth dimension being something you could hang a comic strip plot on, back in the day. (Also back in the day, humor strips with ongoing plots that might run for months were very common. The only syndicated strips like it today are Gasoline Alley, Alley Oop, the current storyline in Safe Havens where they’ve just gone and terraformed Mars, and Popeye, rerunning old daily stories.) The Jeep has many astounding powers, including that he can’t be kept inside — or outside — anywhere against his will, and he’s able to forecast the future.
Could there be a fourth-dimensional animal? I dunno, I’m not a dimensional biologist. It seems like we need a rich chemistry for life to exist. Lots of compounds, many of them long and complicated ones. Can those exist in four dimensions? I don’t know the quantum mechanics of chemical formation well enough to say. I think there’s obvious problems. Electrical attraction and repulsion would fall off much more rapidly with distance than they do in three-dimensional space. This seems like it argues chemical bonds would be weaker things, which generically makes for weaker chemical compounds. So probably a simpler chemistry. On the other hand, what’s interesting in organic chemistry is shapes of molecules, and four dimensions of space offer plenty of room for neat shapes to form. So maybe that compensates for the chemical bonds. I don’t know.
But if we take the premise as given, that there is a four-dimensional animal? With some minor extra assumptions then yeah, the Jeep’s powers fit well enough. Not being able to be enclosed follows almost naturally. You, a three-dimensional being, can’t be held against your will by someone tracing a line on the floor around you. The Jeep — if the fourth dimension is as easy to move through as the third — has the same ability.
Forecasting the future, though? We have a long history of treating time as “the” fourth dimension. There’s ways that this makes good organizational sense. But we do have to treat time as somehow different from space, even to make, for example, general relativity work out. If the Jeep can see and move through time? Well, yeah, then if he wants he can check on something for you, at least if it’s something whose outcome he can witness. If it’s not, though? Well, maybe the flow of events from the fourth dimension is more obvious than it is from a mere three, in the way that maybe you can spot something coming down the creek easily, from above, in a way that people on the water can’t tell.
Olive Oyl and Popeye use the Jeep to tease one another, asking for definite answers about whether the other is cute or not. This seems outside the realm of things that the fourth dimension could explain. In the 1960s cartoons he even picks up the power to electrically shock offenders; I don’t remember if this was in the comic strips at all.
Elzie Segar’s Thimble Theatre rerun for the 29th of October, 2019. It originally ran the 29th of May, 1936. Also wait, where did Wimpy pick up all this talk about the fourth dimension? I guess if you’re going to let a line of smooth patter take the place of working you have to be on top of anything that might come up, but it still seems like a lot of work he’s gone to here to use the Jeep to win horse races.
Elzie Segar’s Thimble Theatre rerun for the 29th of October has Wimpy doing his best to explain the fourth dimension. I think there’s a warning here for mathematician popularizers here. He gets off to a fair start and then it all turns into a muddle. Explaining the fourth dimension in terms of the three dimensions we’re familiar with seems like a good start. Appealing to our intuition to understand something we have to reason about has a long and usually successful history. But then Wimpy goes into a lot of talk about the mystery of things, and it feels like it’s all an appeal to the strangeness of the fourth dimension. I don’t blame Popeye for not feeling it’s cleared anything up. Segar would come back, in this storyline, to several other attempted explanations of the Jeep’s powers, although they do come back around to, y’know, it’s a magical animal. They’re all over the place in the Popeye comic universe.
Zach Weinersmith’s Saturday Morning Breakfast Cereal for the 28th of October is a riff on predictability and encryption. Good encryption schemes rely on randomness. Concealing the content of a message means matching it to an alternate message. Each of the alternate messages should be equally likely to be transmitted. This way, someone who hasn’t got the key would not be able to tell what’s being sent. The catch is that computers do not truly do randomness. They mostly rely on quasirandom schemes that could, in principle, be detected and spoiled. There are ways to get randomness, mostly involving putting in something from the real world. Sensors that detect tiny fluctuations in temperature, for example, or radio detectors. I recall one company going for style and using a wall of lava lamps, so that the rise and fall of lumps were in some way encoded into unpredictable numbers.
Robb Armstrong’s JumpStart for the 2nd of November is a riff on the Birthday “Paradox”, the thing where you’re surprised to find someone shares a birthday with you. (I have one small circle of friends featuring two people who share my birthday, neatly enough.) Paradox is in quotes because it defies only intuition, not logic. The logic is clear that you need only a couple dozen people before some pair will probably share a birthday. Marcie goes overboard in trying to guess how many people at her workplace would share their birthday on top of that. Birthdays are nearly uniformly spread across all days of the year. There are slight variations; September birthdays are a little more likely than, say, April ones; the 13th of any month is a less likely birthday than the 12th or the 24th are. But this is a minor correction, aptly ignored when you’re doing a rough calculation. With 615 birthdays spread out over the year you’d expect the average day to be the birthday of about 1.7 people. (To be not silly about this, a ten-day span should see about 17 birthdays.) However, there are going to be “clumps”, days where three or even four people have birthdays. There will be gaps, days nobody has a birthday, or even streaks of days where nobody has a birthday. If there weren’t a fair number of days with a lot of birthdays, and days with none, we’d have to suspect birthdays weren’t random here.
There were also a handful of comic strips just mentioning mathematics, that I can’t make anything in depth about. Here’s two.
Today’s A To Z term was nominated again by @aajohannas. The other compelling nomination was from Vayuputrii, for the Mittag-Leffler function. I was tempted. But I realized I could not think of a clear way to describe why the function was interesting. Or even where it comes from that avoided being a heap of technical terms. There’s no avoiding technical terms in writing about mathematics, but there’s only so much I want to put in at once either. It also makes me realize I don’t understand the Mittag-Leffler function, but it is after all something I haven’t worked much with.
The Mittag-Leffler function looks like it’s one of those things named for several contributors, like Runge-Kutta Integration or Cauchy-Kovalevskaya Theorem or something. Not so here; this was one person, Gösta Mittag-Leffler. His name’s all over the theory of functions. And he was one of the people helping Sofia Kovalevskaya, whom you know from every list of pioneering women in mathematics, secure her professorship.
A martingale is how mathematicians prove you can’t get rich gambling.
Well, that exaggerates. Some people will be lucky, of course. But there’s no strategy that works. The only strategy that works is to rig the game. You can do this openly, by setting rules that give you a slight edge. You usually have to be the house to do this. Or you can do it covertly, using tricks like card-counting (in blackjack) or weighted dice or other tricks. But a fair game? Meaning one not biased towards or against any player? There’s no strategy to guarantee winning that.
We can make this more technical. Martingales arise from the world of stochastic processes. This is an indexed set of random variables. A random variable is some variable with a value that depends on the result of some phenomenon. A tossed coin. Rolled dice. Number of people crossing a particular walkway over a day. Engine temperature. Value of a stock being traded. Whatever. We can’t forecast what the next value will be. But we know the distribution, which values are more likely and which ones are unlikely and which ones impossible.
The field grew out of studying real-world phenomena. Things we could sample and do statistics on. So it’s hard to think of an index that isn’t time, or some proxy for time like “rolls of the dice”. Stochastic processes turn up all over the place. A lot of what we want to know is impossible, or at least impractical, to exactly forecast. Think of the work needed to forecast how many people will cross this particular walk four days from now. But it’s practical to describe what are more and less likely outcomes. What the average number of walk-crossers will be. What the most likely number will be. Whether to expect tomorrow to be a busier or a slower day.
And this is what the martingale is for. Start with a sequence of your random variables. How many people have crossed that street each day since you started studying. What is the expectation value, the best guess, for the next result? Your best guess for how many will cross tomorrow? Keeping in mind your knowledge of how all these past values. That’s an important piece. It’s not a martingale if the history of results isn’t a factor.
Every probability question has to deal with knowledge. Sometimes it’s easy. The probability of a coin coming up tails next toss? That’s one-half. The probability of a coin coming up tails next toss, given that it came up tails last time? That’s still one-half. The probability of a coin coming up tails next toss, given that it came up tails the last 40 tosses? That’s … starting to make you wonder if this is a fair coin. I’d bet tails, but I’d also ask to examine both sides, for a start.
So a martingale is a stochastic process where we can make forecasts about the future. Particularly, the expectation value. The expectation value is the sum of the products of every possible value and how probable they are. In a martingale, the expected value for all time to come is just the current value. So if whatever it was you’re measuring was, say, 40 this time? That’s your expectation for the whole future. Specific values might be above 40, or below 40, but on average, 40 is it.
Put it that way and you’d think, well, how often does that ever happen? Maybe some freak process will give you that, but most stuff?
Well, here’s one. The random walk. Set a value. At each step, it can increase or decrease by some fixed value. It’s as likely to increase as to decrease. This is a martingale. And it turns out a lot of stuff is random walks. Or can be processed into random walks. Even if the original walk is unbalanced — say it’s more likely to increase than decrease. Then we can do a transformation, and find a new random variable based on the original. Then that one is as likely to increase as decrease. That one is a martingale.
It’s not just random walks. Poisson processes are things where the chance of something happening is tiny, but it has lots of chances to happen. So this measures things like how many car accidents happen on this stretch of road each week. Or where a couple plants will grow together into a forest, as opposed to lone trees. How often a store will have too many customers for the cashiers on hand. These processes by themselves aren’t often martingales. But we can use them to make a new stochastic process, and that one is a martingale.
Where this all comes to gambling is in stopping times. This is a random variable that’s based on the stochastic process you started with. Its value at each index represents the probability that the random variable in that has reached some particular value by this index. The language evokes a gambler’s decision: when do you stop? There are two obvious stopping times for any game. One is to stop when you’ve won enough money. The other is to stop when you’ve lost your whole stake.
So there is something interesting about a martingale that has bounds. It will almost certainly hit at least one of those bounds, in a finite time. (“Almost certainly” has a technical meaning. It’s the same thing I mean when I say if you flip a fair coin infinitely many times then “almost certainly” it’ll come up tails at least once. Like, it’s not impossible that it doesn’t. It just won’t happen.) And for the gambler? The boundary of “runs out of money” is a lot closer than “makes the house run out of money”.
Oh, if you just want a little payoff, that’s fine. If you’re happy to walk away from the table with a one percent profit? You can probably do that. You’re closer to that boundary than to the runs-out-of-money one. A ten percent profit? Maybe so. Making an unlimited amount of money, like you’d want to live on your gambling winnings? No, that just doesn’t happen.
This gets controversial when we turn from gambling to the stock market. Or a lot of financial mathematics. Look at the value of a stock over time. I write “stock” for my convenience. It can be anything with a price that’s constantly open for renegotiation. Stocks, bonds, exchange funds, used cars, fish at the market, anything. The price over time looks like it’s random, at least hour-by-hour. So how can you reliably make money if the fluctuations of the price of a stock are random?
Well, if I knew, I’d have smaller student loans outstanding. But martingales seem like they should offer some guidance. Much of modern finance builds on not dealing with a stock price varying. Instead, buy the right to buy the stock at a set price. Or buy the right to sell the stock at a set price. This lets you pay to secure a certain profit, or a worst-possible loss, in case the price reaches some level. And now you see the martingale. Is it likely that the stock will reach a certain price within this set time? How likely? This can, in principle, guide you to a fair price for this right-to-buy.
The mathematical reasoning behind that is fine, so far as I understand it. Trouble arises because pricing correctly means having a good understanding of how likely it is prices will reach different levels. Fortunately, there are few things humans are better at than estimating probabilities. Especially the probabilities of complicated situations, with abstract and remote dangers.
So martingales are an interesting corner of mathematics. They apply to purely abstract problems like random walks. Or to good mathematical physics problems like Brownian motion and the diffusion of particles. And they’re lurking behind the scenes of the finance news. Exciting stuff.
I apologize to people who want to know the most they can about the comic strips of the past week. I’ve not had time to write about them. Part of what has kept me busy is a visit to Lakemont Park, in Altoona, Pennsylvania. The park has had several bad years, including two years in which it did not open at all. But still standing at the park is the oldest-known roller coaster, Leap The Dips.
My first visit to this park, in 2013, among other things gave me a mathematical question to ask. That is, could any of the many pieces of wood in it be original? How many pieces would you expect?
One of the dips of Leap The Dips. These hills are not large ones. The biggest drop is about nine feet; the coaster is a total of 41 feet high at its greatest. The track goes back and forth in a figure-eight layout several times, and in the middle of each ‘straightaway’ leg is a dip like this.
Problems of this form happen all the time. They turn up whenever there’s something which has a small chance of happening, but many chances to happen. In this case, there’s a small chance that any particular piece of wood will need replacing. But there are a lot of pieces of wood, and they might need replacement at any ride inspection. So there’s an obvious answer to how likely it is any piece of wood would survive a century-plus. And, from that, how much of that wood should be original.
The station for the Leap The Dips roller coaster, Lakemont Park, Altoona, Pennsylvania. There are two separate cars visible on the tracks by the station. When I last visited there was only one car on the tracks. The cars have a front and a back seat, and while there is a bar to grab hold of, there are no other restraints, which makes the low-speed ride more exciting.
The sad thing to say about revisiting Lakemont Park — well, one is that the park has lost almost all its amusement park rides. It’s got athletic facilities, and a couple miniature golf courses, but besides two wooden and one kiddie roller coaster, and an antique-cars ride, there’s not much left of its long history as an amusement park. But the other thing is that Leap The Dips was closed when I was able to visit. The ride’s under repairs, and seems to be getting painted too. This is sad, but I hope it implies better things soon.
Three of the strips I have for this installment feature kids around mathematics talk. That’s enough for a theme name.
Gary Delainey and Gerry Rasmussen’s Betty for the 23rd is a strip about luck. It’s easy to form the superstitious view that you have a finite amount of luck, or that you have good and bad lucks which offset each other. It feels like it. If you haven’t felt like it, then consider that time you got an unexpected $200, hours before your car’s alternator died.
If events are independent, though, that’s just not so. Whether you win $600 in the lottery this week has no effect on whether you win any next week. Similarly whether you’re struck by lightning should have no effect on whether you’re struck again.
Except that this assumes independence. Even defines independence. This is obvious when you consider that, having won $600, it’s easier to buy an extra twenty dollars in lottery tickets and that does increase your (tiny) chance of winning again. If you’re struck by lightning, perhaps it’s because you tend to be someplace that’s often struck by lightning. Probability is a subtler topic than everyone acknowledges, even when they remember that it is such a subtle topic.
Darrin Bell’s Candorville for the 23rd jokes about the uselessness of arithmetic in modern society. I’m a bit surprised at Lemont’s glee in not having to work out tips by hand. The character’s usually a bit of a science nerd. But liking science is different from enjoying doing arithmetic. And bad experiences learning mathematics can sour someone on the subject for life. (Which is true of every subject. Compare the number of people who come out of gym class enjoying physical fitness.)
If you need some Internet Old, read the comments at GoComics, which include people offering dire warnings about what you need in case your machine gives the wrong answer. Which is technically true, but for this application? Getting the wrong answer is not an immediately awful affair. Also a lot of cranky complaining about tipping having risen to 20% just because the United States continues its economic punishment of working peoples.
Zach Weinersmith’s Saturday Morning Breakfast Cereal for the 25th is some wordplay. Mathematicians often need to find minimums of things. Or maximums of things. Being able to do one lets you do the other, as you’d expect. If you didn’t expect, think about it a moment, and then you expect it. So min and max are often grouped together.
Paul Trap’s Thatababy for the 26th is circling around wordplay, turning some common shape names into pictures. This strip might be aimed at mathematics teachers’ doors. I’d certainly accept these as jokes that help someone learn their shapes.
If you’ve been following me on Twitter you’ve seen reports of the Great Migration. This is the pompous name I give to the process of bringing the goldfish who were in tanks in the basement for the winter back outside again. This to let them enjoy the benefits of the summer, like, not having me poking around testing their water every day. (We had a winter with a lot of water quality problems. I’m probably over-testing.)
The Great Migration finally: four goldfish brought outside today. 12 remain in the left tank, 14 in the right, I think.
My reports about moving them back — by setting a net in that could trap some fish and moving them out — included reports of how many remained in each tank. And many people told me how such updates as “Twelve goldfish are in the left tank, three in the right, and fifteen have been brought outside” sound like the start of a story problem. Maybe it does. I don’t have a particular story problem built on this. I’m happy to take nominations for such.
But I did have some mathematics essays based on the problem of moving goldfish to the pond outdoors and to the warm water tank indoors:
How To Count Fish, about how one could estimate a population by sampling it twice.
How To Re-Count Fish, about one of the practical problems in using this to count as few goldfish as we have at our household.
How Not To Count Fish, about how this population estimate wouldn’t work because of the peculiarities of goldfish psychology. Honest.
That I spend one essay describing how to do a thing, and then two more essays describing why it won’t work, may seem characteristically me. Well, yeah. Mathematics is a great tool. To use a tool safely requires understanding its powers and its limitations. I like thinking about what mathematics can and can’t do.
The first, important, thing is that I have not disappeared or done something worse. I just had one of those weeks where enough was happening that something had to give. I could either write up stuff for my mathematics blog, or I could feel guilty about not writing stuff up for my mathematics blog. Since I didn’t have time to do both, I went with feeling guilty about not writing, instead. I’m hoping this week will give me more writing time, but I am fooling only myself.
Second is that Comics Kingdom has, for all my complaining, gotten less bad in the redesign. Mostly in that the whole comics page loads at once, now, instead of needing me to click to “load more comics” every six strips. Good. The strips still appear in weird random orders, especially strips like Prince Valiant that only run on Sundays, but still. I can take seeing a vintage Boner’s Ark Sunday strip six unnecessary times. The strips are still smaller than they used to be, and they’re not using the decent, three-row format that they used to. And the archives don’t let you look at a week’s worth in one page. But it’s less bad, and isn’t that all we can ever hope for out of the Internet anymore?
And finally, Comic Strip Master Command wanted to make this an easy week for me by not having a lot to write about. It got so light I’ve maybe overcompensated. I’m not sure I have enough to write about here, but, I don’t want to completely vanish either.
Dave Whamond’s Reality Check for the 15th is … hm. Well, it’s not an anthropomorphic-numerals joke. It is some kind of wordplay, making concrete a common phrase about, and attitude toward, numbers. I could make the fussy difference between numbers and numerals here but I’m not sure anyone has the patience for that.
Zach Weinersmith’s Saturday Morning Breakfast Cereal for the 17th touches around mathematics without, I admit, necessarily saying anything specific. The angel(?) welcoming the man to heaven mentions creating new systems of mathematics as some fit job for the heavenly host. The discussion of creating self-consistent physics systems seems mathematical in nature too. I’m not sure whether saying one could “attempt” to create self-consistent physics is meant to imply that our universe’s physics are not self-consistent. To create a “maximally complex reality using the simplest possible constructions” seems like a mathematical challenge as well. There are important fields of mathematics built on optimizing, trying to create the most extreme of one thing subject to some constraints or other.
I think the strip’s premise is the old, partially a joke, concept that God is a mathematician. This would explain why the angel(?) seems to rate doing mathematics or mathematics-related projects as so important. But even then … well, consider. There’s nothing about designing new systems of mathematics that ordinary mortals can’t do. Creating new physics or new realities is beyond us, certainly, but designing the rules for such seems possible. I think I understood this comic better then I had thought about it less. Maybe including it in this column has only made trouble for me.
Doug Savage’s Savage Chickens for the 17th amuses me by making a strip out of a logic paradox. It’s not quite your “this statement is a lie” paradox, but it feels close to that, to me. To have the first chicken call it “Birthday Paradox” also teases a familiar probability problem. It’s not a true paradox. It merely surprises people who haven’t encountered the problem before. This would be the question of how many people you need to have in a group before there’s a 50 percent (75 percent, 99 percent, whatever you like) chance of at least one pair sharing a birthday.
And I notice on Wikipedia a neat variation of this birthday problem. This generalization considers splitting people into two distinct groups, and how many people you need in each group to have a set chance of a pair, one person from each group, sharing a birthday. Apparently both a 32-person group of 16 women and 16 men, or a 49-person group of 43 women and six men, have a 50% chance of some woman-man pair sharing a birthday. Neat.
Mark Parisi’s Off The Mark for the 18th sports a bit of wordplay. It’s built on how multiplication and division also have meanings in biology. … If I’m not mis-reading my dictionary, “multiply” meant any increase in number first, and the arithmetic operation we now call multiplication afterwards. Division, similarly, meant to separate into parts before it meant the mathematical operation as well. So it might be fairer to say that multiplication and division are words that picked up mathematical meaning.
I had a slight nagging feeling about this. A couple years back I calculated the most and least probable dates for Easter, on the Gregorian calendar, using the current computus. That essay’s here, with results about how often we can expect Easter and when. It also holds some thoughts about whether the probable dates of Easter are even a thing that can be meaningfully calculated. And it turns out, uncharacteristically, that I forgot to do a follow-up calculating the dates of Easter on the Julian calendar. Maybe I’ll get to it yet.
And we had another of those peculiar days where a lot of strips are on-topic enough for me to talk about.
Eric the Circle, this one by Kyle, for the 26th has a bit of mathematical physics in it. This is the kind of diagram you’ll see all the time, at least if you do the mathematics that tells you where things will be and when. The particular example is an easy problem, a thing rolling down an inclined plane. But the work done for it applies to more complicated problems. The question it’s for is, “what happens when this thing slides down the plane?” And that depends on the forces at work. There’s gravity, certainly . If there were something else it’d be labelled. Gravity’s represented with that arrow pointing straight down. That gives us the direction. The label (Eric)(g) gives us how strong this force is.
Where the diagram gets interesting, and useful, are those dashed lines ending in arrows. One of those lines is, or at least means to be, parallel to the incline. The other is perpendicular to it. These both reflect gravity. We can represent the force of gravity as a vector. That means, we can represent the force of gravity as the sum of vectors. This is like how we can can write “8” or we can write “3 + 5”, depending on what’s more useful for what we’re doing. (For example, if you wanted to work out “67 + 8”, you might be better off doing “67 + 3 + 5”.) The vector parallel to the plane and the one perpendicular to the plane add up to the original gravity vector.
The force that’s parallel to the plane is the only force that’ll actually accelerate Eric. The force perpendicular to the plane just … keeps it snug against the plane. (Well, it can produce friction. We try not to deal with that in introductory physics because it is so hard. At most we might look at whether there’s enough friction to keep Eric from starting to slide downhill.) The magnitude of the force parallel to the plane, and perpendicular to the plane, are easy enough to work out. These two forces and the original gravity can be put together into a little right triangle. It’s the same shape but different size to the right triangle made by the inclined plane plus a horizontal and a vertical axis. So that’s how the diagram knows the parallel force is the original gravity times the sine of x. And that the perpendicular force is the original gravity times the cosine of x.
The perpendicular force is often called the “normal” force. This because mathematical physicists noticed we had only 2,038 other, unrelated, things called “normal”.
Rick Detorie’s One Big Happy for the 26th sees Ruthie demand to know who this Venn person was. Fair question. Mathematics often gets presented as these things that just are. That someone first thought about these things gets forgotten.
John Venn, who lived from 1834 to 1923 — he died the 4th of April, it happens — was an English mathematician and philosopher and logician and (Anglican) priest. This is not a rare combination of professions. From 1862 he was a lecturer in Moral Science at Cambridge. This included work in logic, yes. But he also worked on probability questions. Wikipedia credits his 1866 Logic Of Chance with advancing the frequentist interpretation of probability. This is one of the major schools of thought about what the “probability of an event” is. It’s the one where you list all the things that could possibly happen, and consider how many of those are the thing you’re interested in. So, when you do a problem like “what’s the probability of rolling two six-sided dice and getting a total of four”? You’re doing a frequentist probability problem.
Venn Diagrams he presented to the world around 1880. These show the relationships between different sets. And the relationships of mathematical logic problems they represent. Venn, if my sources aren’t fibbing, didn’t take these diagrams to be a new invention of his own. He wrote of them as “Euler diagrams”. Venn diagrams, properly, need to show all the possible intersections of all the sets in play. You just mark in some way the intersections that happen to have nothing in them. Euler diagrams don’t require this overlapping. The name “Venn diagram” got attached to these pictures in the early 20th century. Euler here is Leonhard Euler, who created every symbol and notation mathematicians use for everything, and who has a different “Euler’s Theorem” that’s foundational to every field of mathematics, including the ones we don’t yet know exist. I exaggerate by 0.04 percent here.
Although we always start Venn diagrams off with circles, they don’t have to be. Circles are good shapes if you have two or three sets. It gets hard to represent all the possible intersections with four circles, though. This is when you start seeing weirder shapes. Wikipedia offers some pictures of Venn diagrams for four, five, and six sets. Meanwhile Mathworld has illustrations for seven- and eleven-set Venn diagrams. At this point, the diagrams are more for aesthetic value than to clarify anything, though. You could draw them with squares. Some people already do. Euler diagrams, particularly, are often squares, sometimes with rounded corners.
Venn had his other projects, too. His biography at St Andrews writes of his composing The Biographical History of Gonville and Caius College (Cambridge). And then he had another history of the whole Cambridge University. It also mentions his skills in building machines, though only cites one, a device for bowling cricket balls. The St Andrews biography says that in 1909 “Venn’s machine clean bowled one of [the Australian Cricket Team’s] top stars four times”. I do not know precisely what it means but I infer it to be a pretty good showing for the machine. His Wikipedia biography calls him a “passionate gardener”. Apparently the Cambridgeshire Horticultural Society awarded him prizes for his roses in July 1885 and for white carrots in September that year. And that he was a supporter of votes for women.
Ashleigh Brilliant’s Pot-Shots for the 26th makes a cute and true claim about percentiles. That a person will usually be in the upper 99% of whatever’s being measured? Hard to dispute. But, measure enough things and eventually you’ll fall out of at least one of them. How many things? This is easy to calculate if we look at different things that are independent of each other. In that case we could look at 69 things before there we’d expect a 50% chance of at least one not being in the upper 99%.
It’s getting that independence that’s hard. There’s often links between things. For example, a person’s height does not tell us much about their weight. But it does tell us something. A person six foot, ten inches tall is almost certainly not also 35 pounds, even though a person could be that size or could be that weight. A person’s scores on a reading comprehension test and their income? But test-taking results and wealth are certainly tied together. Age and income? Most of us have a bigger income at 46 than at 6. This is part of what makes studying populations so hard.
T Shepherd’s Snow Sez for the 26th is finally a strip I can talk about briefly, for a change. Snow does a bit of arithmetic wordplay, toying with what an expression like “1 + 1” might represent.
I didn’t cover quite all of last week’s mathematics comics with Sunday’s essay. There were a handful that all ran on Saturday. And, as has become tradition, I’ll also list a couple that didn’t rate a couple paragraphs.
Rick Kirkman and Jerry Scott’s Baby Blues for the 23rd has a neat variation on story problems. Zoe’s given the assignment to make her own. I don’t remember getting this as homework, in elementary school, but it’s hard to see why I wouldn’t. It’s a great exercise: not just set up an arithmetic problem to solve, but a reason one would want to solve it.
Composing problems is a challenge. It’s a skill, and you might be surprised that when I was in grad school we didn’t get much training in it. We were just taken to be naturally aware of how to identify a skill one wanted to test, and to design a question that would mostly test that skill, and to write it out in a question that challenged students to identify what they were to do and how to do it, and why they might want to do it. But as a grad student I wasn’t being prepared to teach elementary school students, just undergraduates.
Mastroianni and Hart’s B.C. for the 23rd is a joke in the funny-definition category, this for “chaos theory”. Chaos theory formed as a mathematical field in the 60s and 70s, and it got popular alongside the fractal boom in the 80s. The field can be traced back to the 1890s, though, which is astounding. There was no way in the 1890s to do the millions of calculations needed to visualize any good chaos-theory problem. They had to develop results entirely by thinking.
Wiley’s definition is fine enough about certain systems being unpredictable. Wiley calls them “advanced”, although they don’t need to be that advanced. A compound pendulum — a solid rod that swings on the end of another swinging rod — can be chaotic. You can call that “advanced” if you want but then people are going to ask if you’ve had your mind blown by this post-singularity invention, the “screw”.
What makes for chaos is not randomness. Anyone knows the random is unpredictable in detail. That’s no insight. What’s exciting is when something’s unpredictable but deterministic. Here it’s useful to think of continental divides. These are the imaginary curves which mark the difference in where water runs. Pour a cup of water on one side of the line, and if it doesn’t evaporate, it eventually flows to the Pacific Ocean. Pour the cup of water on the other side, it eventually flows to the Atlantic Ocean. These divides are often wriggly things. Water may mostly flow downhill, but it has to go around a lot of hills.
So pour the water on that line. Where does it go? There’s no unpredictability in it. The water on one side of the line goes to one ocean, the water on the other side, to the other ocean. But where is the boundary? And that can be so wriggly, so crumpled up on itself, so twisted, that there’s no meaningfully saying. There’s just this zone where the Pacific Basin and the Atlantic Basin merge into one another. Any drop of water, however tiny, dropped in this zone lands on both sides. And that is chaos.
Neatly for my purposes there’s even a mountain at a great example of this boundary. Triple Divide Peak, in Montana, rests on the divides between the Atlantic and the Pacific basins, and also on the divide between the Atlantic and the Arctic oceans. (If one interprets the Hudson Bay as connecting to the Arctic rather than the Atlantic Ocean, anyway. If one takes Hudson Bay to be on the Atlantic Ocean, then Snow Dome, Alberta/British Columbia, is the triple point.) There’s a spot on this mountain (or the other one) where a spilled cup of water could go to any of three oceans.
John Graziano’s Ripley’s Believe It Or Not for the 23rd mentions one of those beloved bits of mathematics trivia, the birthday problem. That’s finding the probability that no two people in a group of some particular size will share a birthday. Or, equivalently, the probability that at least two people share some birthday. That’s not a specific day, mind you, just that some two people share a birthday. The version that usually draws attention is the relatively low number of people needed to get a 50% chance there’s some birthday pair. I haven’t seen the probability of 70 people having at least one birthday pair before. 99.9 percent seems plausible enough.
The birthday problem usually gets calculated something like this: Grant that one person has a birthday. That’s one day out of either 365 or 366, depending on whether we consider leap days. Consider a second person. There are 364 out of 365 chances that this person’s birthday is not the same as the first person’s. (Or 365 out of 366 chances. Doesn’t make a real difference.) Consider a third person. There are 363 out of 365 chances that this person’s birthday is going to be neither the first nor the second person’s. So the chance that all three have different birthdays is . Consider the fourth person. That person has 362 out of 365 chances to have a birthday none of the first three have claimed. So the chance that all four have different birthdays is . And so on. The chance that at least two people share a birthday is 1 minus the chance that no two people share a birthday.
As always happens there are some things being assumed here. Whether these probability calculations are right depends on those assumptions. The first assumption being made is independence: that no one person’s birthday affects when another person’s is likely to be. Obvious, you say? What if we have twins in the room? What if we’re talking about the birthday problem at a convention of twins and triplets? Or people who enjoyed the minor renown of being their city’s First Babies of the Year? (If you ever don’t like the result of a probability question, ask about the independence of events. Mathematicians like to assume independence, because it makes a lot of work easier. But assuming isn’t the same thing as having it.)
The second assumption is that birthdates are uniformly distributed. That is, that a person picked from a room is no more likely to be born the 13th of February than they are the 24th of September. And that is not quite so. September births are (in the United States) slightly more likely than other months, for example, which suggests certain activities going on around New Year’s. Across all months (again in the United States) birthdates of the 13th are slightly less likely than other days of the month. I imagine this has to be accounted for by people who are able to select a due date by inducing delivery. (Again if you need to attack a probability question you don’t like, ask about the uniformity of whatever random thing is in place. Mathematicians like to assume uniform randomness, because it akes a lot of work easier. But assuming it isn’t the same as proving it.)
Do these differences mess up the birthday problem results? Probably not that much. We are talking about slight variations from uniform distribution. But I’ll be watching Ripley’s to see if it says anything about births being more common in September, or less common on 13ths.
And now the comics I didn’t find worth discussing. They’re all reruns, it happens. Morrie Turner’s Wee Pals rerun for the 20th just mentions mathematics class. That could be any class that has tests coming up, though. Percy Crosby’s Skippy for the 21st is not quite the anthropomorphic numerals jokes for the week. It’s getting around that territory, though, as Skippy claims to have the manifestation of a zero. Bill Rechin’s Crock for the 22nd is a “pick any number” joke. I discussed as much as I could think of about this when it last appeared, in May of 2018. Also I’m surprised that Crock is rerunning strips that quickly now. It has, in principle, decades of strips to draw from.
I do not know that the Ziggy printed here is a rerun. I don’t seem to have mentioned it in previous Reading the Comics posts, but that isn’t definite. How much mathematical content a comic strip needs to rate a mention depends on many things, and a strip that seems too slight one week might inspire me another. I’ll explain why I’ve started to get suspicious of the quite humanoid figure.
Tom II Wilson’s Ziggy for the 12th is framed around weather forecasts. It’s the probability question people encounter most often, unless they’re trying to outsmart the contestants on Let’s Make A Deal. (And many games on The Price Is Right, too.) Many people have complained about not knowing the meaning of a “50% chance of rain” for a day. If I understand it rightly, it means, when conditions have been like this in the recorded past, it’s rained about 50% of the time. I’m open to correction from meteorologists and it just occurred to me I know one. Mm.
Few people ask about the probability a forecast is correct. In some ways it’s an unanswerable question. To say there is a one-in-six chance a fairly thrown die will turn up a ‘1’ is not wrong just because it’s rolled a ‘1’ eight times out of the last ten. But it does seem like a forecast such as this should include a sense of confidence, how sure the forecaster is that the current weather is all that much like earlier times.
I’m not sure how much of the joke is meant to be the repetition of “50% chance”. The joke might be meant to say that if he’s got a 50% chance of being wrong, then, isn’t the 50% chance of rain “correctly” a 50% chance of not-rain … which is the same chance of rain? The logic doesn’t hold up, if you pay attention, but it sounds like it should make sense, and having the “wrong” version of something be the same as the original is a valid comic construction.
So now for the promised Ziggy rerun scandal. To the best of my knowledge Ziggy is presented as being in new run. It’s done by the son of the comic strip’s creator, but that’s common enough for long-running comic strips. This Monday, though, ran a Ziggy-at-the-psychiatrist joke that was, apart from coloring, exactly the comic run the 2nd of March, barely two weeks before. (Compare the scribbles in the psychiatrist’s diploma.) It wouldn’t be that weird if a comic were accidentally repeated; production mistakes happen, after all. It’s slightly weird that the daily, black-and-white, original got colored in two different ways, but I can imagine this happening by accident.
Still, that got me primed to look for Ziggy repeats. I couldn’t find this one having an earlier appearance. But I did find that the 9th of January this year was a reprint of the Ziggy from the 11th of January, 2017. I wrote about both appearances, without noticing they were reruns. Here’s the 2017 essay, and over here is the 2019 essay, from before I was very good at remembering what the year was. Mercifully I didn’t say anything contradictory on the two appearances. I’m more interested in how I said things differently in the two appearances. Anyway this earlier year seems to have been part of a week’s worth of reruns, noticeable by the copyright date. I can’t begrudge a cartoonist their vacation. The psychiatrist strip doesn’t seem to be part of that, though, and its repetition is some as-yet-unexplained event.
Tony Rubino and Gary Markstein’s Daddy’s Home for the 13th has a much more casual and non-controversial bit of mathematics. Pete tosses out a calculate-the-square-root problem as a test of Peggy’s omniscience. One of the commenters points out that the square root of 532 is closer to 23.06512519 than it is Peggy’s 23.06512818. It suggests the writers found the square root by something that gave plenty of digits. For example, the macOS Calculator program offers me “23.065 125 189 341 592”. But then they chopped off, rather than rounding off, digits when the panel space ran out.
Olivia Jaimes’s Nancy for the 13th has Nancy dividing up mathematics problems along the equals sign. That’s cute and fanciful enough. One could imagine working out expressions on either side of the equals sign in the hopes of getting them to match. That wouldn’t work for these algebra problems, but, that’s something.
This isn’t what Nancy might do, unless she flashed forward to college and became a mathematics or physics major. But one great trick in differential equations is called the separation of variables. Differential equations describe how quantities change. They’re great. They’re hard. A lot of solving differential equations amounts to rewriting them as simpler differential equations.
Separation is a trick usable when there’s two quantities whose variation affect each other. If you can rewrite the differential equation so that one variable only appears on the left side, and the other variable only appears on the right? Then you can split this equation into two simpler equations. Both sides of the equation have to be some fixed number. So you can separate the differential equations of two variables into two differential equations, each with one variable. One with the first variable, one with the other. And, usually, a differential equation of one variable is easier than a differential equation with two variables. So Nancy and Esther could work each half by themselves. But the work would have to be put together at the end, too.
I hope you’ll pardon me for being busy. I haven’t had the chance to read all the Pi Day comic strips yet today. But I’d be a fool to let the day pass without something around here. I confess I’m still not sure that Pi Day does anything lasting to encourage people to think more warmly of mathematics. But there is probably some benefit if people temporarily think more fondly of the subject. Certainly I’ll do more foolish things than to point at things and say, “pi, cool, huh?” this week alone.
I’ve got a couple of essays that discuss π some. The first noteworthy one is Calculating Pi Terribly, discussing a way to calculate the value of π using nothing but a needle, a tile floor, and a hilariously excessive amount of time. Or you can use an HTML5-and-JavaScript applet and slightly less time, and maybe even experimentally calculate the digits of π to two decimal places, if you get lucky.
In Calculating Pi Less Terribly I showed a way to calculate π that’s … well, you see where that sentence was going. This is a method that uses an alternating series. To get π exactly correct you have to do an infinite amount of work. But if you just want π to a certain precision, all right. This will even tell you how much work you have to do. There are other formulas that will get you digits of π with less work, though, and maybe I’ll write up one of those sometime.
And the last of the relevant essays I’ve already written is an A To Z essay about normal numbers. I don’t know whether π is a normal number. No human, to the best of my knowledge, does. Well, anyone with an opinion on the matter would likely say, of course it’s normal. There’s fantastic reasons to think it is. But none of those amount to a proof it is.
That’s my three items. After that I’d like to share … I don’t know whether to classify this as one or three pieces. They’re YouTube videos which a couple months ago everybody in the world was asking me if I’d seen. Now it’s your turn. I apologize if you too got this, a couple months ago, but don’t worry. You can tell people you watched and not actually do it. I’ll alibi you.
It’s a string of videos posted on youTube by 3Blue1Brown. The first lays out the matter with a neat physics problem. Imagine you have an impenetrable wall, a frictionless floor, and two blocks. One starts at rest. The other is sliding towards the first block and the wall. How many times will one thing collide with another? That is, will one block collide with another block, or will one block collide with a wall?
The answer seems like it should depend on many things. What it actually depends on is the ratio of the masses of the two blocks. If they’re the same mass, then there are three collisions. You can probably work that sequence out in your head and convince yourself it’s right. If the outer block has ten times the mass of the inner block? There’ll be 31 collisions before all the hits are done. You might work that out by hand. I did not. You will not work out what happens if the outer block has 100 times the mass of the inner block. That’ll be 314 collisions. If the outer block has 1,000 times the mass of the inner block? 3,141 collisions. You see where this is going.
The video shows a way that saves an incredible load of work. But you save on that tedious labor by having to think harder. Part of it is making use of conservation laws, that energy and linear momentum are conserved in collisions. But part is by recasting the problem. Recast it into “phase space”. This uses points in an abstract space to represent different configurations of a system. Like, how fast blocks are moving, and in what direction. The recasting of the problem turns something that’s impossibly tedious into something that’s merely … well, it’s still a bit tedious. But it’s much less hard work. And it’s a good chance to show off you remember the Inscribed Angle Theorem. You do remember the Inscribed Angle Theorem, don’t you? The video will catch you up. It’s a good show of how phase spaces can make physics problems so much more manageable.
The third video recasts the problem yet again. In this form, it’s about rays of light reflecting between mirrors. And this is a great recasting. That blocks bouncing off each other and walls should have anything to do with light hitting mirrors seems ridiculous. But set out your phase space, and look hard at what collisions and reflections are like, and you see the resemblance. The sort of trick used to make counting reflections easy turns up often in phase spaces. It also turns up in physics problems on toruses, doughnut shapes. You might ask when do we ever do anything on a doughnut shape. Well, real physical doughnuts, not so much. But problems where there are two independent quantities, and both quantities are periodic? There’s a torus lurking in there. There might be a phase space using that shape, and making your life easier by doing so.
Today’s quartet of mathematically-themed comic strips doesn’t have an overwhelming theme. There’s some bits about the mathematics that young people do, so, that’s enough to separate this from any other given day’s comics essay.
Zach Weinersmith’s Saturday Morning Breakfast Cereal for the 14th is built on a bit of mathematical folklore. As Weinersmith’s mathematician (I don’t remember that we’ve been given her name) mentions, there is a belief that “revolutionary” mathematics is done by young people. That isn’t to say that older mathematicians don’t do great work. But the stereotype is that an older mathematician will produce masterpieces in already-established fields. It’s the young that establish new fields. Indeed, one of mathematics’s most prestigious awards, the Fields Medal, is only awarded to mathematicians under the age of forty. I was cheated of mine. Long story.
There’s intuitive appeal in the idea that revolutions in thinking are for the young. We think that people get set in their ways as they develop their careers. We have a couple dramatic examples, most notably Évariste Galois, who developed what we now see as foundations of group theory and died at twenty. While the idea is commonly held, I don’t know that it’s actually true. That is, that it holds up to scrutiny. It seems hard to create a definition for “revolutionary mathematics” that could be agreed upon by two people. So it would be difficult to test at what age people do their most breathtaking work, and whether it is what they do when young or when experienced.
Is there harm to believing an unprovable thing? If it makes you give up on trying, yes. My suspicion is that true revolutionary work happens when a well-informed, deep thinker comes to a field that hasn’t been studied in that way before. And when it turns out to be a field well-suited to study that way. That doesn’t require youth. It requires skill in one field, and an understanding that there’s another field ready to be studied that way.
Will Henry’s Wallace the Brave for the 14th is a mathematics anxiety joke. Wallace tries to help by turning an abstract problem into a concrete one. This is often a good way to approach a problem. Even in more advanced mathematics, one can often learn the way to solve a general problem by trying a couple of specific examples. It’s almost as though there’s only a certain amount of abstraction people can deal with, and you need to re-cast problems so they stay within your limits.
Yes, the comments turn to complaining about Common Core. I’m not sure what would help Spud work through this problem (or problems in general). But thinking of alternate problems that estimated or approached what he really wanted might help. If he noticed, for example, that 10 + 12 has to be a little more than 10 + 10, and he found 10 + 10 easy, then he’d be close to a right answer. If he noticed that 10 + 12 had to be 10 + 10 + 2, and he found 10 + 10 easy, then he might find 20 + 2 easy as well. Maybe Spud would be better off thinking of ways to rewrite a problem without changing the result.
Wiley Miller’s Non Sequitur for the 15th mentions calculus. It’s more of a probability joke. To speak of a calculated risk is to speak of doing something that’s not certain, but that has enough of a payoff to be worth the cost of failure. But one problem with this attitude is that people are very, very bad at estimating probabilities. We have terrible ideas of how likely losses are and how uncertain rewards can be. But even if we allow that the risks and rewards are calculated right, there’s a problem with things you only do once. Or only can do once. You can get into a good debate about whether there’s even a meaningful idea of probability for things that happen only the one time. Life’s among them.
Bob Weber Sr’s Moose and Molly for the 16th is a homework joke. It does actually depend on being mathematics homework, though, or there’d be no grounds for Moose’s kid to go to the savings and loan clerk who’ll help with “money problems”.
With me wrapping up the mathematically-themed comic strips that ran the first of the year, you can see how far behind I’m falling keeping everything current. In my defense, Monday was busier than I hoped it would be, so everything ran late. Next week is looking quite slow for comics, so maybe I can catch up then. I will never catch up on anything the rest of my life, ever.
Scott Hilburn’s The Argyle Sweater for the 2nd is a bit of wordplay about regular and irregular polygons. Many mathematical constructs, in geometry and elsewhere, come in “regular” and “irregular” forms. The regular form usually has symmetries that make it stand out. For polygons, this is each side having the same length, and each interior angle being congruent. Irregular is everything else. The symmetries which constrain the regular version of anything often mean we can prove things we otherwise can’t. But most of anything is the irregular. We might know fewer interesting things about them, or have a harder time proving them.
I’m not sure what the teacher would be asking for in how to “make an irregular polygon regular”. I mean if we pretend that it’s not setting up the laxative joke. I can think of two alternatives that would make sense. One is to draw a polygon with the same number of sides and the same perimeter as the original. The other is to draw a polygon with the same number of sides and the same area as the original. I’m not sure of the point of either. I suppose polygons of the same area have some connection to quadrature, that is, integration. But that seems like it’s higher-level stuff than this class should be doing. I hate to question the reality of a comic strip but that’s what I’m forced to do.
Bud Fisher’s Mutt and Jeff rerun for the 4th is a gambler’s fallacy joke. Superficially the gambler’s fallacy seems to make perfect sense: the chance of twelve bad things in a row has to be less than the chance of eleven bad things in a row. So after eleven bad things, the twelfth has to come up good, right? But there’s two ways this can go wrong.
Suppose each attempted thing is independent. In this case, what if each patient is equally likely to live or die, regardless of what’s come before? And in that case, the eleven deaths don’t make it more likely that the next will live.
Suppose each attempted thing is not independent, though. This is easy to imagine. Each surgery, for example, is a chance for the surgeon to learn what to do, or not do. He could be getting better, that is, more likely to succeed, each operation. Or the failures could reflect the surgeon’s skills declining, perhaps from overwork or age or a loss of confidence. Impossible to say without more data. Eleven deaths on what context suggests are low-risk operations suggest a poor chances of surviving any given surgery, though. I’m on Jeff’s side here.
Mark Anderson’s Andertoons for the 5th is a welcome return of Wavehead. It’s about ratios. My impression is that ratios don’t get much attention in themselves anymore, except to dunk on stupid Twitter comments. It’s too easy to jump right into fractions, and division. Ratios underlie this, at least historically. It’s even in the name, ‘rational numbers’.
Wavehead’s got a point in literally comparing apples and oranges. It’s at least weird to compare directly different kinds of things. This is one of those conceptual gaps between ancient mathematics and modern mathematics. We’re comfortable stripping the units off of numbers, and working with them as abstract entities. But that does mean we can calculate things that don’t make sense. This produces the occasional bit of fun on social media where we see something like Google trying to estimate a movie’s box office per square inch of land in Australia. Just because numbers can be combined doesn’t mean they should be.
Larry Wright’s Motley rerun for the 5th has the form of a story problem. And one timely to the strip’s original appearance in 1987, during the National Football League players strike. The setup, talking about the difference in weekly pay between the real players and the scabs, seems like it’s about the payroll difference. The punchline jumps to another bit of mathematics, the point spread. Which is an estimate of the expected difference in scoring between teams. I don’t know for a fact, but would imagine the scab teams had nearly meaningless point spreads. The teams were thrown together extremely quickly, without much training time. The tools to forecast what a team might do wouldn’t have the data to rely on.
I apologize that, even though the past week was light on mathematically-themed comic strips, I didn’t have them written up by my usual Sunday posting time. It was just too busy a week, and I am still decompressing from the A to Z sequence. I’ll have them as soon as I’m able.
In the meanwhile may I share a couple of things I thought worth reading, and that have been waiting in my notes folder for the chance to highlight?
There are around 7000 people currently living in this planet who got 20 tails in a row the first time they tried flipping a coin in their life pic.twitter.com/LvUWs4jnLA
This Fermat’s Library tweet is one of those entertaining consequences of probability, multiplied by the large number of people in the world. If you flip twenty coins in a row there’s a one in 1,048,576 chance that all twenty will come up heads, or all twenty will come up tails. So about one in every million times you flip twenty coins, they all come up the same way. If the seven billion people in the world have flipped at least twenty coins in their lives, then something like seven thousand of them had the coins turn up heads every single one of those twenty times. That all seven billion people have tossed a coin seems like the biggest point to attack this trivia on. A lot of people are too young, or don’t have access to, coins. But there’s still going to be thousands who did start their coin-flipping lives with a remarkable streak.
Also back in October, so you see how long things have been circulating around here, John D Cook published an article about the World Series. Or any series contest. At least ones where the chance of each side winning don’t depend on the previous games in the series. If one side has a probability ‘p’ of winning any particular game, what’s the chance they’ll win a best-four-of-seven? What makes this a more challenging mathematics problem is that a best-of-seven series stops after one side’s won four games. So you can’t simply say it’s the chance of four wins. You need to account for four wins out of five games, out of six games, and out of seven games. Fortunately there’s a lot of old mathematics that explores just this.
The economist Brandford DeLong noticed the first write-up of the Prisoners Dilemma. This is one of the first bits of game theory that anyone learns, and it’s an important bit. It establishes that the logic of cooperatives games — any project where people have to work together — can have a terrible outcome. What makes the most sense for the individuals makes the least sense for the group. That a good outcome for everyone depends on trust, whether established through history or through constraints everyone’s agreed to respect.
And finally here’s part of a series about quick little divisibility tests. This is that trick where you tell what a number’s divisible by through adding or subtracting its (base ten) digits. Everyone who’d be reading this post knows about testing for divisibility by three or nine. Here’s some rules for also testing divisibility by eleven (which you might know), by seven (less likely), and thirteen. With a bit of practice, and awareness of some exceptional numbers, you can tell by sight whether a number smaller than a thousand is prime. Add a bit of flourish to your doing this and you can establish a reputation as a magical mathematician.
I had not wanted to mention, for fear of setting off a panic. But Mark Anderson’s Andertoons, which I think of as being in every Reading the Comics post, hasn’t been around lately. If I’m not missing something, it hasn’t made an appearance in three months now. I don’t know why, and I’ve been trying not to look too worried by it. Mostly I’ve been forgetting to mention the strange absence. This even though I would think any given Tuesday or Friday that I should talk about the strip not having anything for me to write about. Fretting about it would make a great running theme. But I have never spotted a running theme before it’s finished. In any event the good news is that the long drought has ended, and Andertoons reappears this week. Yes, I’m hoping that it won’t be going to long between appearances this time.
Jef Mallett’s Frazz for the 16th talks about probabilities. This in the context of assessing risks. People are really bad at estimating probabilities. We’re notoriously worse at assessing risks, especially when it’s a matter of balancing a present cost like “fifteen minutes waiting while the pharmacy figures out whether insurance will pay for the flu shot” versus a nebulous benefit like “lessened chance of getting influenza, or at least having a less severe influenza”. And it’s asymmetric, too. We view improbable but potentially enormous losses differently from the way we view improbable but potentially enormous gains. And it’s hard to make the rationally-correct choice reliably, not when there are so many choices of this kind every day.
Tak Bui’s PC and Pixel for the 16th features a wall full of mathematical symbols, used to represent deep thought about a topic. The symbols are gibberish, yes. I’m not sure that an actual “escape probability” could be done in a legible way, though. Or even what precisely Professor Phillip might be calculating. I imagine it would be an estimate of the various ways he might try to escape, and what things might affect that. This might be for the purpose of figuring out what he might do to maximize his chances of a successful escape. Although I wouldn’t put it past the professor to just be quite curious what the odds are. There’s a thrill in having a problem solved, even if you don’t use the answer for anything.
Ruben Bolling’s Super-Fun-Pak Comix for the 18th has a trivia-panel-spoof dubbed Amazing Yet Tautological. One could make an argument that most mathematics trivia fits into this category. At least anything about something that’s been proven. Anyway, whether this is a tautological strip depends on what the strip means by “average” in the phrase “average serving”. There’s about four jillion things dubbed “average” and each of them has a context in which they make sense. The thing intended here, and the thing meant if nobody says anything otherwise, is the “arithmetic mean”. That’s what you get from adding up everything in a sample (here, the amount of egg salad each person in America eats per year) and dividing it by the size of the sample (the number of people in America that year). Another “average” which would make sense, but would break this strip, would be the median. That would be the amount of egg salad that half of all Americans eat more than, and half eat less than. But whether every American could have that big a serving really depends on what that median is. The “mode”, the most common serving, would also be a reasonable “average” to expect someone to talk about.
Mark Anderson’s Andertoons for the 19th is that strip’s much-awaited return to my column here. It features solid geometry, which is both an important part of geometry and also a part that doesn’t get nearly as much attention as plane geometry. It’s reductive to suppose the problem is that it’s harder to draw solids than planar figures. I suspect that’s a fair part of the problem, though. Mathematicians don’t get much art training, not anymore. And while geometry is supposed to be able to rely on pure reasoning, a good picture still helps. And a bad picture will lead us into trouble.
My final glossary term for this year’s A To Z sequence was suggested by aajohannas, who’d also suggested “randomness” and “tiling”. I don’t know of any blogs or other projects they’re behind, but if I do hear, I’ll pass them on.
Some areas of mathematics struggle against the question, “So what is this useful for?” As though usefulness were a particular merit — or demerit — for a field of human study. Most mathematics fields discover some use, though, even if it takes centuries. Others are born useful. Probability, for example. Statistics. Know what the fields are and you know why they’re valuable.
Game theory is another of these. The subject, as often happens, we can trace back centuries. Usually as the study of some particular game. Occasionally in the study of some political science problem. But game theory developed a particular identity in the early 20th century. Some of this from set theory experts. Some from probability experts. Some from John von Neumann, because it was the 20th century and all that. Calling it “game theory” explains why anyone might like to study it. Who doesn’t like playing games? Who, studying a game, doesn’t want to play it better?
But why it might be interesting is different from why it might be important. Think of what a game is. It is a string of choices made by one or more parties. The point of the choices is to achieve some goal. Put that way you realize: this is everything. All life is making choices, all in the pursuit of some goal, even if that goal is just “not end up any worse off”. I don’t know that the earliest researchers in game theory as a field realized what a powerful subject they had touched on. But by the 1950s they were doing serious work in strategic planning, and by 1964 were even giving us Stanley Kubrick movies.
This is taking me away from my glossary term. The field of games is enormous. If we narrow the field some we can discuss specific kinds of games. And say more involved things about these games. So first we’ll limit things by thinking only of sequential games. These are ones where there are a set number of players, and they take turns making choices. I’m not sure whether the field expects the order of play to be the same every time. My understanding is that much of the focus is on two-player games. What’s important is that at any one step there’s only one party making a choice.
The other thing narrowing the field is to think of information. There are many things that can affect the state of the game. Some of them might be obvious, like where the pieces are on the game board. Or how much money a player has. We’re used to that. But there can be hidden information. A player might conceal some game money so as to make other players underestimate her resources. Many card games have one or more cards concealed from the other players. There can be information unknown to any party. No one can make a useful prediction what the next throw of the game dice will be. Or what the next event card will be.
But there are games where there’s none of this ambiguity. These are called games with “perfect information”. In them all the players know the past moves every player has made. Or at least should know them. Players are allowed to forget what they ought to know.
There’s a separate but similar-sounding idea called “complete information”. In a game with complete information, players know everything that affects the gameplay. At least, probably, apart from what their opponents intend to do. This might sound like an impossibly high standard, at first. All games with shuffled decks of cards and with dice to roll are out. There’s no concealing or lying about the state of affairs.
Set complete-information aside; we don’t need it here. Think only of perfect-information games. What are they? Some ancient games, certainly. Tic-tac-toe, for example. Some more modern versions, like Connect Four and its variations. Some that are actually deep, like checkers and chess and go. Some that are, arguably, more puzzles than games, as in sudoku. Some that hardly seem like games, like several people agreeing how to cut a cake fairly. Some that seem like tests to prove people are fundamentally stupid, like when you auction off a dollar. (The rules are set so players can easily end up paying more then a dollar.) But that’s enough for me, at least. You can see there are games of clear, tangible interest here.
The last restriction: think only of two-player games. Or at least two parties. Any of these two-party sequential games with perfect information are a part of “combinatorial game theory”. It doesn’t usually allow for incomplete-information games. But at least the MathWorld glossary doesn’t demand they be ruled out. So I will defer to this authority. I’m not sure how the name “combinatorial” got attached to this kind of game. My guess is that it seems like you should be able to list all the possible combinations of legal moves. That number may be enormous, as chess and go players are always going on about. But you could imagine a vast book which lists every possible game. If your friend ever challenged you to a game of chess the two of you could simply agree, oh, you’ll play game number 2,038,940,949,172 and then look up to see who won. Quite the time-saver.
Most games don’t have such a book, though. Players have to act on what they understand of the current state, and what they think the other player will do. This is where we get strategies from. Not just what we plan to do, but what we imagine the other party plans to do. When working out a strategy we often expect the other party to play perfectly. That is, to make no mistakes, to not do anything that worsens their position. Or that reduces their chance of winning.
… And yes, arguably, the word “chance” doesn’t belong there. These are games where the rules are known, every past move is known, every future move is in principle computable. And if we suppose everyone is making the best possible move then we can imagine forecasting the whole future of the game. One player has a “chance” of winning in the same way Christmas day of the year 2038 has a “chance” of being on a Tuesday. That is, the probability is just an expression of our ignorance, that we don’t happen to be able to look it up.
But what choice do we have? I’ve never seen a reference that lists all the possible games of tic-tac-toe. And that’s about the simplest combinatorial-game-theory game anyone might actually play. What’s possible is to look at the current state of the game. And evaluate which player seems to be closer to her goal. And then look at all the possible moves.
There are three things a move can do. It can put the party closer to the goal. It can put the party farther from the goal. Or it can do neither. On her turn the other party might do something that moves you farther from your goal, moves you closer to your goal, or doesn’t affect your status at all. It seems like this makes strategy obvious. On every step take the available move that takes one closest to the goal. This is known as a “greedy” strategy. As the name suggests it isn’t automatically bad. If you expect the game to be a short one, greed might be the best approach. The catch is that moves that seem less good — even ones that seem to hurt you initially — might set up other, even better moves. So strategy requires some thinking beyond the current step. Properly, it requires thinking through to the end of the game. Or at least until the end of the game seems obvious.
We should like a strategy that leaves us no choice but to win. Next-best would be one that leaves the game undecided, since something might happen like the other player needing to catch a bus and so resigning. This is how I got my solitary win in the two months I spent in the college chess club. Worst would be the games that leave us no choice but to lose.
It can be that there are no good moves. That is, that every move available makes it a little less likely that we win. Sometimes a game offers the chance to pass, preserving the state of the game but giving the other party the turn. Then maybe the other party will do something that creates a better opportunity for us. But if we are allowed to pass, there’s a good chance the game lets the other party pass, too, and we end up in the same fix. And it may be the rules of the game don’t allow passing anyway. One must move.
The phenomenon of having to make a move when it’s impossible to make a good move has prominence in chess. I don’t have the chess knowledge to say how common the situation is. But it seems to be a situation people who study chess problems love. I suppose it appeals to a love of lost causes and the hope that you can be brilliant enough to see what everyone else has overlooked. German chess literates gave it a name 160 years ago, “zugzwang”, “compulsion to move”. Somehow I never encountered the term when I was briefly a college chess player. Perhaps because I was never in zugzwang and was just too incompetent a player to find my good moves. I first encountered the term in Michael Chabon’s The Yiddish Policeman’s Union. The protagonist picked up on the term as he investigated the murder of a chess player and then felt himself in one.
Combinatorial game theorists have picked up the word, and sharpened its meaning. If I understand correctly chess players allow the term to be used for any case where a player hurts her position by moving at all. Game theorists make it more dire. This may reflect their knowledge that an optimal strategy might require taking some dismal steps along the way. The game theorist formally grants the term only to the situation where the compulsion to move changes what should be a win into a loss. This seems terrible, but then, we’ve all done this in play. We all feel terrible about it.
I’d like here to give examples. But in searching the web I can find only either courses in game theory. These are a bit too much for even me to sumarize. Or chess problems, which I’m not up to understanding. It seems hard to set out an example: I need to not just set out the game, but show that what had been a win is now, by any available move, turned into a loss. Chess is looser. It even allows, I discover, a double zugzwang, where both players are at a disadvantage if they have to move.
It’s a quite relatable problem. You see why game theory has this reputation as mathematics that touches all life.
I know I encountered the Witch of Agnesi while in middle school. Eighth grade, if I’m not mistaken. It was a footnote in a textbook. I don’t remember much of the textbook. What I mostly remember of the course was how much I did not fit with the teacher. The only relief from boredom that year was the month we had a substitute and the occasional interesting footnote.
It was in a chapter about graphing equations. That is, finding curves whose points have coordinates that satisfy some equation. In a bit of relief from lines and parabolas the footnote offered this:
In a weird tantalizing moment the footnote didn’t offer a picture. Or say what an ‘a’ was doing in there. In retrospect I recognize ‘a’ as a parameter, and that different values of it give different but related shapes. No hint what the ‘8’ or the ‘4’ were doing there. Nor why ‘a’ gets raised to the third power in the numerator or the second in the denominator. I did my best with the tools I had at the time. Picked a nice easy boring ‘a’. Picked out values of ‘x’ and found the corresponding ‘y’ which made the equation true, and tried connecting the dots. The result didn’t look anything like a witch. Nor a witch’s hat.
It was one of a handful of biographical notes in the book. These were a little attempt to add some historical context to mathematics. It wasn’t much. But it was an attempt to show that mathematics came from people. Including, here, from Maria Gaëtana Agnesi. She was, I’m certain, the only woman mentioned in the textbook I’ve otherwise completely forgotten.
We have few names of ancient mathematicians. Those we have are often compilers like Euclid whose fame obliterated the people whose work they explained. Or they’re like Pythagoras, credited with discoveries by people who obliterated their own identities. In later times we have the mathematics done by, mostly, people whose social positions gave them time to write mathematics results. So we see centuries where every mathematician is doing it as their side hustle to being a priest or lawyer or physician or combination of these. Women don’t get the chance to stand out here.
Today of course we can name many women who did, and do, mathematics. We can name Emmy Noether, Ada Lovelace, and Marie-Sophie Germain. Challenged to do a bit more, we can offer Florence Nightingale and Sofia Kovalevskaya. Well, and also Grace Hopper and Margaret Hamilton if we decide computer scientists count. Katherine Johnson looks likely to make that cut. But in any case none of these people are known for work understandable in a pre-algebra textbook. This must be why Agnesi earned a place in this book. She’s among the earliest women we can specifically credit with doing noteworthy mathematics. (Also physics, but that’s off point for me.) Her curve might be a little advanced for that textbook’s intended audience. But it’s not far off, and pondering questions like “why ? Why not ?” is more pleasant, to a certain personality, than pondering what a directrix might be and why we might use one.
The equation might be a lousy way to visualize the curve described. The curve is one of that group of interesting shapes you get by constructions. That is, following some novel process. Constructions are fun. They’re almost a craft project.
For this we start with a circle. And two parallel tangent lines. Without loss of generality, suppose they’re horizontal, so, there’s lines at the top and the bottom of the curve.
Take one of the two tangent points. Again without loss of generality, let’s say the bottom one. Draw a line from that point over to the other line. Anywhere on the other line. There’s a point where the line you drew intersects the circle. There’s another point where it intersects the other parallel line. We’ll find a new point by combining pieces of these two points. The point is on the same horizontal as wherever your line intersects the circle. It’s on the same vertical as wherever your line intersects the other parallel line. This point is on the Witch of Agnesi curve.
Now draw another line. Again, starting from the lower tangent point and going up to the other parallel line. Again it intersects the circle somewhere. This gives another point on the Witch of Agnesi curve. Draw another line. Another intersection with the circle, another intersection with the opposite parallel line. Another point on the Witch of Agnesi curve. And so on. Keep doing this. When you’ve drawn all the lines that reach from the tangent point to the other line, you’ll have generated the full Witch of Agnesi curve. This takes more work than writing out , yes. But it’s more fun. It makes for neat animations. And I think it prepares us to expect the shape of the curve.
It’s a neat curve. Between it and the lower parallel line is an area four times that of the circle that generated it. The shape is one we would get from looking at the derivative of the arctangent. So there’s some reasons someone working in calculus might find it interesting. And people did. Pierre de Fermat studied it, and found this area. Isaac Newton and Luigi Guido Grandi studied the shape, using this circle-and-parallel-lines construction. Maria Agnesi’s name attached to it after she published a calculus textbook which examined this curve. She showed, according to people who present themselves as having read her book, the curve and how to find it. And she showed its equation and found the vertex and asymptote line and the inflection points. The inflection points, here, are where the curve chances from being cupped upward to cupping downward, or vice-versa.
It’s a neat function. It’s got some uses. It’s a natural smooth-hill shape, for example. So this makes a good generic landscape feature if you’re modeling the flow over a surface. I read that solitary waves can have this curve’s shape, too.
And the curve turns up as a probability distribution. Take a fixed point. Pick lines at random that pass through this point. See where those lines reach a separate, straight line. Some regions are more likely to be intersected than are others. Chart how often any particular line is the new intersection point. That chart will (given some assumptions I ask you to pretend you agree with) be a Witch of Agnesi curve. This might not surprise you. It seems inevitable from the circle-and-intersecting-line construction process. And that’s nice enough. As a distribution it looks like the usual Gaussian bell curve.
It’s different, though. And it’s different in strange ways. Like, for a probability distribution we can find an expected value. That’s … well, what it sounds like. But this is the strange probability distribution for which the law of large numbers does not work. Imagine an experiment that produces real numbers, with the frequency of each number given by this distribution. Run the experiment zillions of times. What’s the mean value of all the zillions of generated numbers? And it … doesn’t … have one. I mean, we know it ought to, it should be the center of that hill. But the calculations for that don’t work right. Taking a bigger sample makes the sample mean jump around more, not less, the way every other distribution should work. It’s a weird idea.
Imagine carving a block of wood in the shape of this curve, with a horizontal lower bound and the Witch of Agnesi curve as the upper bound. Where would it balance? … The normal mathematical tools don’t say, even though the shape has an obvious line of symmetry. And a finite area. You don’t get this kind of weirdness with parabolas.
(Yes, you’ll get a balancing point if you actually carve a real one. This is because you work with finitely-long blocks of wood. Imagine you had a block of wood infinite in length. Then you would see some strange behavior.)
It teaches us more strange things, though. Consider interpolations, that is, taking a couple data points and fitting a curve to them. We usually start out looking for polynomials when we interpolate data points. This is because everything is polynomials. Toss in more data points. We need a higher-order polynomial, but we can usually fit all the given points. But sometimes polynomials won’t work. A problem called Runge’s Phenomenon can happen, where the more data points you have the worse your polynomial interpolation is. The Witch of Agnesi curve is one of those. Carl Runge used points on this curve, and trying to fit polynomials to those points, to discover the problem. More data and higher-order polynomials make for worse interpolations. You get curves that look less and less like the original Witch. Runge is himself famous to mathematicians, known for “Runge-Kutta”. That’s a family of techniques to solve differential equations numerically. I don’t know whether Runge came to the weirdness of the Witch of Agnesi curve from considering how errors build in numerical integration. I can imagine it, though. The topics feel related to me.
I understand how none of this could fit that textbook’s slender footnote. I’m not sure any of the really good parts of the Witch of Agnesi could even fit thematically in that textbook. At least beyond the fact of its interesting name, which any good blog about the curve will explain. That there was no picture, and that the equation was beyond what the textbook had been describing, made it a challenge. Maybe not seeing what the shape was teased the mathematician out of this bored student.
And next is ‘X’. Will I take Mr Wu’s suggestion and use that to describe something “extreme”? Or will I take another topic or suggestion? We’ll see on Friday, barring unpleasant surprises. Thanks for reading.
This installment took longer to write than you’d figure, because it’s the time of year we’re watching a lot of mostly Rankin/Bass Christmas specials around here. So I have to squeeze words out in-between baffling moments of animation and, like, arguing whether there’s any possibility that Jack Frost was not meant to be a Groundhog Day special that got rewritten to Christmas because the networks weren’t having it otherwise.
Jeffrey Caulfield and Brian Ponshock’s Yaffle for the 3rd is the anthropomorphic numerals joke for the week. … You know, I’ve always wondered in this sort of setting, what are two-digit numbers like? I mean, what’s the difference between a twelve and a one-and-two just standing near one another? How do people recognize a solitary number? This is a darned silly thing to wonder so there’s probably a good web comic about it.
John Hambrock’s The Brilliant Mind of Edison Lee for the 4th has Edison forecast the outcome of a basketball game. I can’t imagine anyone really believing in forecasting the outcome, though. The elements of forecasting a sporting event are plausible enough. We can suppose a game to be a string of events. Each of them has possible outcomes. Some of them score points. Some block the other team’s score. Some cause control of the ball (or whatever makes scoring possible) to change teams. Some take a player out, for a while or for the rest of the game. So it’s possible to run through a simulated game. If you know well enough how the people playing do various things? How they’re likely to respond to different states of things? You could certainly simulate that.
But all sorts of crazy things will happen, one game or another. Run the same simulation again, with different random numbers. The final score will likely be different. The course of action certainly will. Run the same simulation many times over. Vary it a little; what happens if the best player is a little worse than average? A little better? What if the referees make a lot of mistakes? What if the weather affects the outcome? What if the weather is a little different? So each possible outcome of the sporting event has some chance. We have a distribution of the possible results. We can judge an expected value, and what the range of likely outcomes is. This demands a lot of data about the players, though. Edison Lee can have it, I suppose. The premise of the strip is that he’s a genius of unlimited competence. It would be more likely to expect for college and professional teams.
Brian Basset’s Red and Rover for the 4th uses arithmetic as the homework to get torn up. I’m not sure it’s just a cameo appearance. It makes a difference to the joke as told that there’s division and long division, after all. But it could really be any subject.
Today’s topic is an always rich one. It was suggested by aajohannas, who so far as I know has’t got an active blog or other project. If I’m mistaken please let me know. I’m glad to mention the creative works of people hanging around my blog.
An old Sydney Harris cartoon I probably won’t be able to find a copy of before this publishes. A couple people gather around an old fanfold-paper printer. On the printout is the sequence “1 … 2 … 3 … 4 … 5 … ” The caption: ‘Bizarre sequence of computer-generated random numbers’.
Randomness feels familiar. It feels knowable. It means surprise, unpredictability. The upending of patterns. The obliteration of structure. I imagine there are sociologists who’d say it’s what defines Modernity. It’s hard to avoid noticing that the first great scientific theories that embrace unpredictability — evolution and thermodynamics — came to public awareness at the same time impressionism came to arts, and the subconscious mind came to psychology. It’s grown since then. Quantum mechanics is built on unpredictable specifics. Chaos theory tells us even if we could predict statistics it would do us no good. Randomness feels familiar, even necessary. Even desirable. A certain type of nerd thinks eagerly of the Singularity, the point past which no social interactions are predictable anymore. We live in randomness.
And yet … it is hard to find randomness. At least to be sure we have found it. We might choose between options we find ambivalent by tossing a coin. This seems random. But anyone who was six years old and trying to cheat a sibling knows ways around that. Drop the coin without spinning it, from a half-inch above the table, and you know the outcome, all the way through to the sibling’s punching you. When we’re older and can be made to be better sports we’re fairer about it. We toss the coin and give it a spin. There’s no way we could predict the outcome. Unless we knew just how strong a toss we gave it, and how fast it spun, and how the mass of the coin was distributed. … Really, if we knew enough, our tossed coin would be as predictably as the coin we dropped as a six-year-old. At least unless we tossed in some chaotic way, where each throw would be deterministic, but we couldn’t usefully make a prediction.
Dice are also predictable, if you are able to precisely measure how the weight inside them is distributed, and can be precise enough about how you’ll throw them, and know enough about the surface they’ll roll on. Screen capture from TrekCore’s archive of Star Trek: The Next Generation images.
Our instinctive idea of what randomness must be is flawed. That shouldn’t surprise. Our instinctive idea of anything is flawed. But randomness gives us trouble. It’s obvious, for example, that randomly selected things should have no pattern. But then how is that reasonable? If we draw letters from the alphabet at random, we should expect sometimes to get some cute pattern like ‘aaaaa’ or ‘qwertyuiop’ or the works of Shakespeare. Perhaps we mean we shouldn’t get patterns any more often than we would expect. All right; how often is that?
We can make tests. Some of them are obvious. Take something that generates possibly-random results. Look up how probable each of those outcomes is. Then run off a bunch of outcomes. Do we get about as many of each result as we should expect? Probability tells us we should get as close as we like to the expected frequency if we let the random process run long enough. If this doesn’t happen, great! We can conclude we don’t really have something random.
We can do more tests. Some of them are brilliantly clever. Suppose there’s a way to order the results. Since mathematicians usually want numbers, putting them in order is easy to do. If they’re not, there’s usually a way to match results to numbers. You’ll see me slide here into talking about random numbers as though that were the same as random results. But if I can distinguish different outcomes, then I can label them. If I can label them, I can use numbers as labels. If the order of the numbers doesn’t matter — should “red” be a 1 or a 2? Should “green” be a 3 or an 8? — then, fine; any order is good.
There are 120 ways to order five distinct things. So generate lots of sets of, say, five numbers. What order are they in? There’s 120 possibilities. Do each of the possibilities turn up as often as expected? If they don’t, great! We can conclude we don’t really have something random.
I can go on. There are many tests which will let us say something isn’t a truly random sequence. They’ll allow for something like Sydney Harris’s peculiar sequence of random numbers. Mostly by supposing that if we let it run long enough the sequence would stop. But these all rule out random number generators. Do we have any that rule them in? That say yes, this generates randomness?
I don’t know of any. I suspect there can’t be any, on the grounds that a test of a thousand or a thousand million or a thousand million quadrillion numbers can’t assure us the generator won’t break down next time we use it. If we knew the algorithm by which the random numbers were generated — oh, but there we’re foiled before we can start. An algorithm is the instructions of how to do a thing. How can an instruction tell us how to do a thing that can’t be predicted?
Algorithms seem, briefly, to offer a way to tell whether we do have a good random sequence, though. We can describe patterns. A strong pattern is easy to describe, the way a familiar story is easy to reference. A weak pattern, a random one, is hard to describe. It’s like a dream, in which you can just list events. So we can call random something which can’t be described any more efficiently than just giving a list of all the results. But how do we know that can’t be done? 7, 7, 2, 4, 5, 3, 8, 5, 0, 9 looks like a pretty good set of digits, whole numbers from 0 through 9. I’ll bet not more than one in ten of you guesses correctly what the next digit in the sequence is. Unless you’ve noticed that these are the digits in the square root of π, so that the next couple digits have to be 0, 5, 5, and 1.
We know, on theoretical grounds, that we have randomness all around us. Quantum mechanics depends on it. If we need truly random numbers we can set a sensor. It will turn the arrival of cosmic rays, or the decay of radioactive atoms, or the sighing of a material flexing in the heat into numbers. We trust we gather these and process them in a way that doesn’t spoil their unpredictability. To what end?
That is, why do we care about randomness? Especially why should mathematicians care? The image of mathematics is that it is a series of logical deductions. That is, things known to be true because they follow from premises known to be true. Where can randomness fit?
One answer, one close to my heart, is called Monte Carlo methods. These are techniques that find approximate answers to questions. They do well when exact answers are too hard for us to find. They use random numbers to approximate answers and, often, to make approximate answers better. This demands computations. The field didn’t really exist before computers, although there are some neat forebears. I mean the Buffon needle problem, which lets you calculate the digits of π about as slowly as you could hope to do.
Another, linked to Monte Carlo methods, is stochastic geometry. “Stochastic” is the word mathematicians attach to things when they feel they’ve said “random” too often, or in an undignified manner. Stochastic geometery is what we can know about shapes when there’s randomness about how the shapes are formed. This sounds like it’d be too weak a subject to study. That it’s built on relatively weak assumptions means it describes things in many fields, though. It can be seen in understanding how forests grow. How to find structures inside images. How to place cell phone towers. Why materials should act like they do instead of some other way. Why galaxies cluster.
There’s also a stochastic calculus, a bit of calculus with randomness added. This is useful for understanding systems where some persistent unpredictable behavior is there. It comes, if I understand the histories of this right, from studying the ways molecules will move around in weird zig-zagging twists. They do this even when there is no overall flow, just a fluid at a fixed temperature. It too has surprising applications. Without the assumption that some prices of things are regularly jostled by arbitrary and unpredictable forces, and the treatment of that by stochastic calculus methods, we wouldn’t have nearly the ability to hedge investments against weird chaotic events. This would be a bad thing, I am told by people with more sophisticated investments than I have. I personally own like ten shares of the Tootsie Roll corporation and am working my way to a $2.00 rebate check from Boyer.
Rye Playland’s is the fastest carousel I’m aware of running. Riders are warned ahead of time to sit so they’re leaning to the left, and the ride will not get up to full speed until the ride operator checks everyone during the ride. To get some idea of its speed, notice the ride operator on the left and how far he leans. He’s not being dramatic; that’s the natural stance. Also the tilt in the carousel’s floor is not camera trickery; it does lean like that.
Given that we need randomness, but don’t know how to get it — or at least don’t know how to be sure we have it — what is there to do? We accept our failings and make do with “quasirandom numbers”. We find some process that generates numbers which look about like random numbers should. These have failings. Most important is that if we could predict them. They’re random like “the date Easter will fall on” is random. The date Easter will fall is not at all random; it’s defined by a specific and humanly knowable formula. But if the only information you have is that this year, Easter fell on the 1st of April (Gregorian computus), you don’t have much guidance to whether this coming year it’ll be on the 7th, 14th, or 21st of April the next year. Most notably, quasirandom number generators will tend to repeat after enough numbers are drawn. If we know we won’t need enough numbers to see a repetition, though? Another stereotype of the mathematician is that of a person who demands exactness. It is often more true to say she is looking for an answer good enough. We are usually all right with a merely good enough quasirandomness.
Boyer candies — Mallo Cups, most famously, although I more like the peanut butter Smoothies — come with a cardboard card backing. Each card has two play money “coins”, of values from 5 cents to 50 cents. These can be gathered up for a rebate check or for various prizes. Whether your coin is 5 cents, 10, 25, or 50 cents … well, there’s no way to tell, before you open the package. It’s, so far as you can tell, randomness.


![A numeral 2 is on the page. Alice, offscreen, asks: 'Petey, what letter is that?' Petey: 'It's the *number* two.' Alice: 'Is it happy or sad?' Petey: 'I don't know.' Alice: 'It's a girl, right? And it's green?' The numeral is now green, has long hair, and a smile. Petey: 'Well --- ' Alice: 'Does she wear a hat? Like a beret?' 'A hat?' The numeral now has a beret. Alice: 'Does she have a pet? I'll give her a few hamsters. Petey: 'A pet?' There are a copule hamsters around the 2 now. Alice: 'She likes *this* number.' Petey: 'Why --- ' The other number is a 5. Alice: 'But not *this* number. [ It's a 9. ] Because he's not looking at her.' The 2 is frowning at the 9. Petey: 'How do you --- ' Alice: 'What kind of music does she listen to?' Petey: 'ALICE! Stop asking me all this stuff! *I'm* no good at math!' Alice, upset: 'So it's up to *me* to be the family genius ... '](https://nebusresearch.wordpress.com/wp-content/uploads/2022/07/cul-de-sac_richard-thompson_2022-07july-03.jpeg)
 as a pleasant, well-behaved function, but is likely to see
  as a troublesome one. These examples all tie to how easy they are to do other stuff with. But it is natural to think fondly of things you see a lot that work nicely for you. These don’t always have to be “nice” things. If you want to test an idea about continuous curves, for example, it’s convenient to have handy the Koch curve. It’s this spiky fractal that’s nothing but corners, and you can use it to see if the idea holds up. Do this enough, and you come to see a reliable partner to your work.


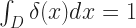
 , then we define a function
 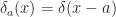 and are done. Translation is a simple step, but it turns out to be useful all the time.


 and
and  . In linear algebra, when we might want to think about Euclidean spaces with possibly enormously many dimensions, we may change the names to
  and
and  . (We could use subscripts of 0 and 1, although I do not remember ever seeing someone do that.)


 inches of rain overnight, even if we did. We recorded 0.71 inches after the storm.

![[NORMAL SCIENTIST] Person: 'No mathematics, no science can ever predict the human soul!' Normal Scientist: 'That's not even a specific claim!? What does it even mean?!' [COMPUTER SCIENtiST] Person: 'No mathematics, no science can ever predict the human soul!' Computer Scientist: 'Ooh! We can use it for cryptography!'](https://nebusresearch.wordpress.com/wp-content/uploads/2019/11/saturday-morning-breakfast-cereal_zach-weinersmith_28-october-2019.gif)


 . Consider the fourth person. That person has 362 out of 365 chances to have a birthday none of the first three have claimed. So the chance that all four have different birthdays is
  . And so on. The chance that at least two people share a birthday is 1 minus the chance that no two people share a birthday.


![[PI sces ] Guy at bar talking to Pi: 'Wow, so you were born on March 14th at 1:59, 26 seconds? What're the odds?'](https://nebusresearch.wordpress.com/wp-content/uploads/2018/03/scott-hilburn_argyle-sweater_14-march-2018.gif)


![[ To Stephen Hawking, Thanks for making the Universe a little easier for the rest of us to understand ] Jay: 'I suppose it's only appropriate that he'd go on Pi Day.' Roy: 'Not to mention, Einstein's birthday.' Katherine: 'I'll bet they're off in some far reach of the universe right now playing backgammon.'](https://nebusresearch.wordpress.com/wp-content/uploads/2018/03/john-zakour-scott-roberts_working-daze_15-march-2018.gif)


 ? Why not
  ?” is more pleasant, to a certain personality, than pondering what a directrix might be and why we might use one.
  , yes. But it’s more fun.


